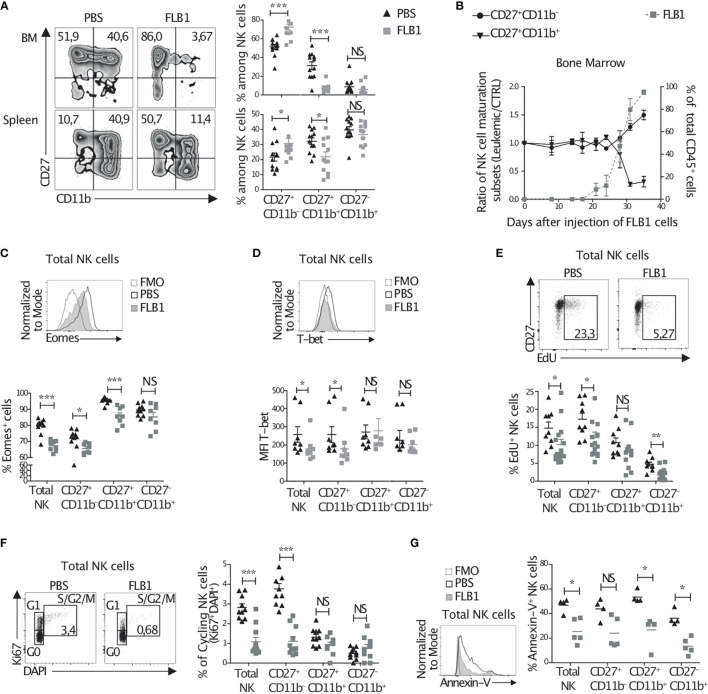
Figure 1.
NK cell maturation and homeostasis are altered in leukemic mice. (A–D) Freshly isolated cells from the bone marrow (BM) or the spleen of leukemic (FLB1 injected) or control (PBS injected) mice were stained and analyzed by flow cytometry. (A) Left: the percentages on zebra plots indicate the CD27+CD11b— and CD27+CD11b+ NK cell populations in relation to total NK1.1+CD3-CD19- cells. Right: the percentages of all three NK cell maturation subsets, as determined by CD27 and CD11b expression, in the BM (upper graph) and spleen (bottom graph) (n=12 mice/group in four independent experiments). (B) The percentages of CD27+CD11b— and CD27+CD11b+ NK cell maturation subsets (left Y axis) and of CD45.1+ FLB1 cells (right Y axis) evaluated by flow cytometry in the BM at the indicated days after FLB1 injection (n=2-6 mice/group in two independent experiments). (C) The percentage of Eomes positive cells in relation to total NK cells and NK cell maturation subsets in the BM of leukemic or control mice (n=8-10 mice/group in two independent experiments). (D) The level of expression of T-bet in total NK cells and NK cell maturation subsets in the BM of leukemic or control mice (n= 8 mice/group in three independent experiments). (E, F) Leukemic or control mice were injected twice with 100μg of EdU 12h apart. 36h after the second injection of EdU, mice were sacrificed and BM cells were extracted and stained to measure EdU incorporation. Cells were also stained with DAPI and anti-NK1.1, -CD3, -CD19, -CD27, -CD11b and -Ki67 antibodies and were analyzed by flow cytometry. (E) The percentage on dot plots indicate the percentage of EdU incorporation in total NK cells of leukemic and control mice. The graph represents the percentage of EdU positive NK cells and NK cell maturation subsets. (F) The percentage on dot plots indicate the percentage of NK cells Ki67+DAPI+ in S/G2/M phase or cycling NK cells. The graph represents the percentage of cycling cells of total NK cells and of the three NK cell maturation subsets (n=10-11 mice/group in three independent experiments). (G) BM cells freshly isolated from control and leukemic mice were stained and analyzed by flow cytometry to determine the percentage of apoptotic cells defined as total Annexin-V(AnnV)+ cells (n=4-5 mice/group in three independent experiments). The values are presented as the mean +/- SEM. *p < 0.05, **p < 0.01, ***p < 0.001, NS, Non Significant, as determined by Mann-Whitney test.

