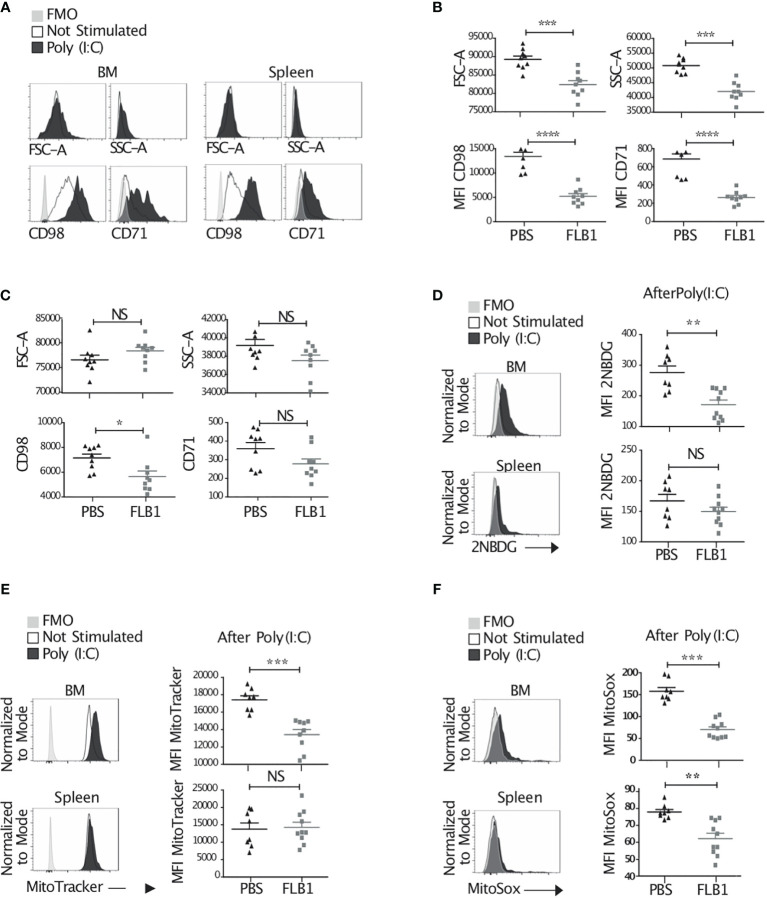
Figure 5.
Reduced metabolic response and exhausted features by NK cells from leukemic mice. (A–F) Mice were injected or not with 100μg Poly(I:C) and sacrificed 16h later. Bone marrow (BM) and splenic cells were extracted, stained and analyzed by flow cytometry. (A) Histograms represent the size, granularity, and the expression of nutrient transporters by NK cells. (B, C) MFI of FSC-A, SSC-A, CD98 and CD71 by total BM (B) or splenic (C) NK cells of control (PBS injected) and leukemic (FLB1 injected) mice after Poly(I:C) injection (n=9 mice/group in two independent experiments). (D–F) Histograms represent the glucose uptake (D), the mitochondrial mass (E) and the mitochondrial reactive oxygen species (F) by total BM and splenic NK cells of control mice not stimulated or stimulated with Poly(I:C) (Left panel). The graphs show MFI for 2NBDG (D), MitoTracker (E) and MitoSox (F) expression by NK cells of control and leukemic mice after Poly(I:C) injection (right panel) (n=8-10 mice/group in two independent experiments). (A, D, E, F) Representative data of NK cells from control mice not stimulated (empty lines), stimulated with Poly(I:C) (black filled lines) and negative controls (FMO, grey shade). The values are presented as the mean +/- SEM. *p < 0.05, **p < 0.01, ***p < 0.001, ****p < 0.0001, NS, Non Significant, as determined by Mann-Whitney test.

