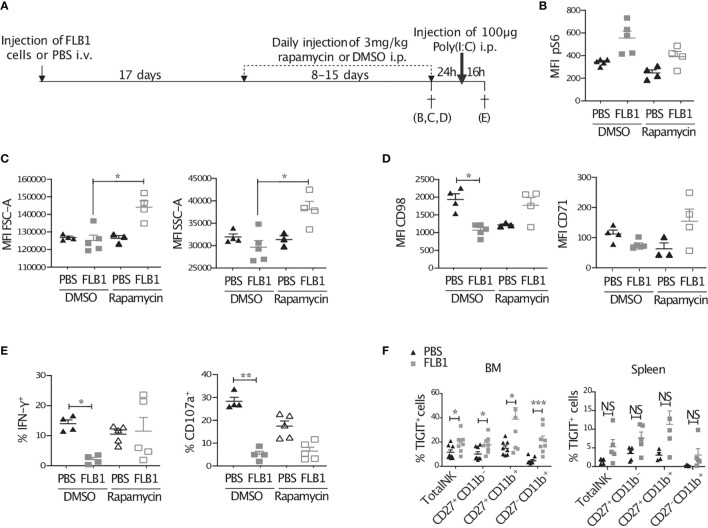
Figure 6.
Treatment of mice with rapamycin improves the metabolic fitness and IFN-γ production of NK cells from leukemic mice. (A) Schematic representation of the protocol. Control (PBS injected) or leukemic (FLB1 injected) mice were treated with daily injection of rapamycin or DMSO for 8 to 15 days. The duration of the treatment was dependent of the leukemic progression in mice and was stopped when the percentage of FLB1 cells reaches 10-20% of total white blood cells in peripheral blood. Mice were then sacrificed (B–D), or kept for 24h without treatment and then injected with 100 µg Poly(I:C) and sacrificed 16h later (E) (n=3-5 mice/group). (B) The graph represents the level of phosphorylation of S6, expressed as MFI, in bone marrow (BM) NK cells. (C) The graphs represent the size (FSC), granularity (SSC) of BM-NK cells. (D) The graphs represent the level of expression of nutrient transporters (CD98 and CD71) in BM-NK cells. (E) Freshly extracted splenocytes were stained and analyzed by flow cytometry. The graphs represent the percentage of NK cells expressing IFN-γ and the marker of degranulation CD107a. (F) Freshly isolated BM and splenic cells of leukemic or control mice were stained and analyzed by flow cytometry. The graphs show the percentage of NK cells and NK cell maturation subsets expressing TIGIT (BM: n=8 mice/group in three independent experiments; Spleen: n=4-5 mice/group). The values are presented as the mean +/- SEM. *p < 0.05, **p < 0.01, ***p < 0.001, NS, Non Significant as determined by Kruskal-Wallis test (B–E) or Mann-Whitney test (F).

