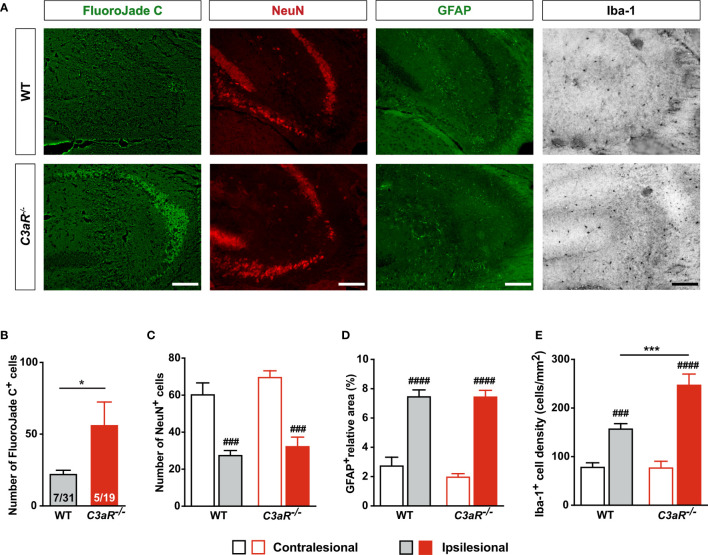
Figure 4.
HI-induced neurodegeneration is increased in mice lacking C3aR. (A) Representative images of ipsilesional CA3 stained with FJC and antibodies against NeuN, GFAP and Iba-1 7 weeks after HI induction. Scale bar = 50 µm. (B) Number of FJC+ cells and (C) NeuN+ cells, (D) relative GFAP+ area, and (E) density of Iba-1+ cells in CA3 of WT and C3aR–/– mice. IL, ipsilesional; CL, contralesional; *P < 0.05; ***P < 0.001 vs WT; ### P < 0.001, #### P < 0.0005 vs contralesional. Data were analyzed by two-tailed unpaired t test (B) or two-way ANOVA and Tukey’s posthoc test (C–E). Numbers in the bars in (B) are number of positive mice/total number of mice. (C–E) n = 7 (WT) and 5 (C3aR–/– ). Values are mean ± SEM.

