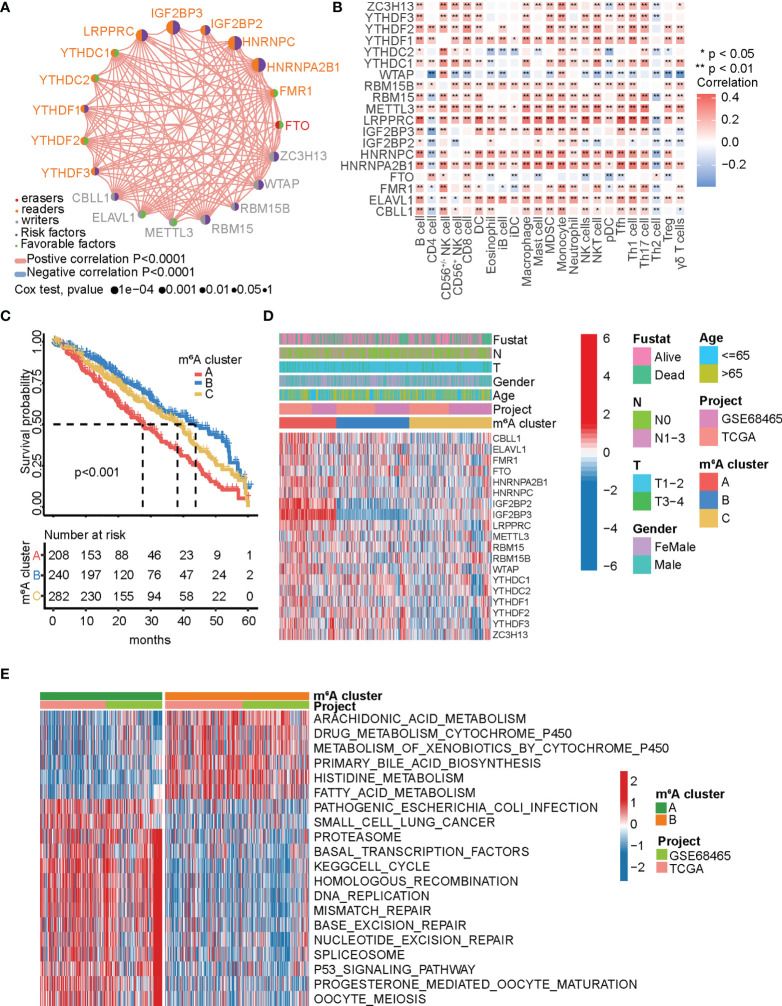
Figure 2.
m6A methylation patterns and related biological processes. (A) The interplay among the m6A regulators in LUAD. The m6A regulators in three RNA modification types were indicated by the different colors in the circle left. Favorable factors for patients’ survival were indicated by grass green in the circle right and risk factors indicated by blue in the circle right. The circle size indicates the influence of each regulator on prognosis, and the range of values calculated by Log-rank test was represented by the size of each circle. The lines connecting the regulators show their interplay, and the thickness indicates the strength of the association between the regulators. Negative correlation was marked with blue and positive correlation with red. (B) Analysis of the relationship between each tumor-infiltrating immune cell type and each m6A regulator in LUAD using Spearman’s analysis. Red indicates positive correlation; blue indicates negative correlation. * p < 0.05, ** p < 0.01. (C) Survival analyses for the three m6A modification patterns in from TCGA-LUAD and GSE68645, including 208 cases of m6A cluster A, 240 cases of m6A cluster B, and 282 cases of m6A cluster C. Log-rank test, p < 0.0001. (D) Heatmap showing the correlation between the three m6A clusters and the clinicopathological characteristics. Clinicopathological information including age, gender, fustat, and tumor stage, as well as the m6A cluster, is shown in annotations above. Red represents high expression, and blue represents low expression. (E) Heatmap showing the biological processes in different m6A modification patterns obtained by GSVA enrichment analysis. Red shows activated pathways and blue shows inhibited pathways. m6A cluster A vs. m6A cluster B.

