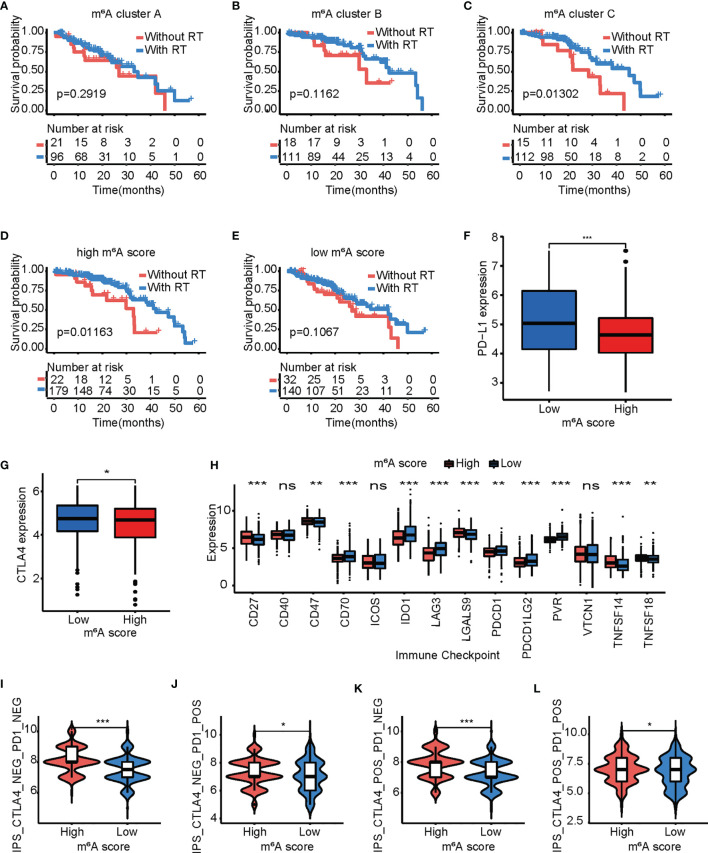
Figure 8.
The m6A score model predicts the benefits of radiotherapy and immunotherapy. (A–C) Kaplan-Meier curves of overall survival for patients in m6A cluster A (A), m6A cluster B (B), and m6A cluster C (C) based on acceptance/rejection of radiotherapy. Log-rank test. (D, E) Kaplan-Meier curves of overall survival for patients with a high (D)/low (E) m6A score based on acceptance/rejection of radiotherapy. Log-rank test. (F, G) Comparison of the PD-1 (F)/CTLA4 (G) expression levels between the high and low m6A score groups. Log-rank test. (ns p > 0.05;* p < 0.05; ** p < 0.01; *** p < 0.001). (H) Differences in the expression of other immune checkpoints between the high and low m6A score groups. Log-rank test. (* p < 0.05; ** p < 0.01; *** p < 0.001). (I–L) Box plot representing the relative distribution of the immunophenoscore between the low and high m6A score groups in LUAD patients based on TCIA database, (I) CTLA4− PD1−; (J) CTLA4− PD1+; (K) CTLA4+ PD1−; and (L) CTLA4+ PD1+. The asterisks represented the statistical p-value (*p < 0.05; ***p < 0.001).

