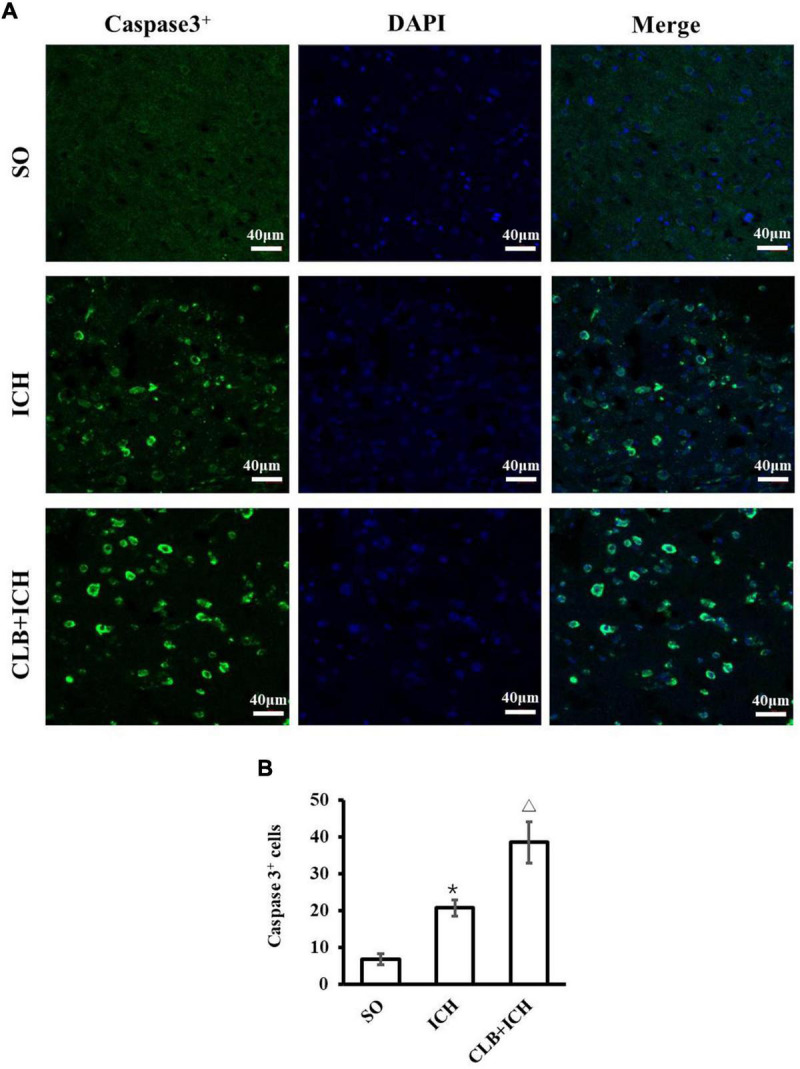
FIGURE 2.

Results of neuronal apoptosis 3 days after ICH in three groups. (A) Representative immunofluorescent images of Active caspase-3 (green) and DAPI (blue) staining (×200). Scale bar: 40 μm. (B) Quantitative analysis showed more apoptotic cells 3 days in ICH and CLB + ICH groups than in SO group (*P < 0.05). The numbers of active caspase-3cells in hemorrhagic rat brain tissues of CLB + ICH group were further increased comparing with those in ICH group (△, P < 0.05). SO group, n = 5; ICH group, n = 5; and CLB + ICH group, n = 5.
