FIGURE 5.
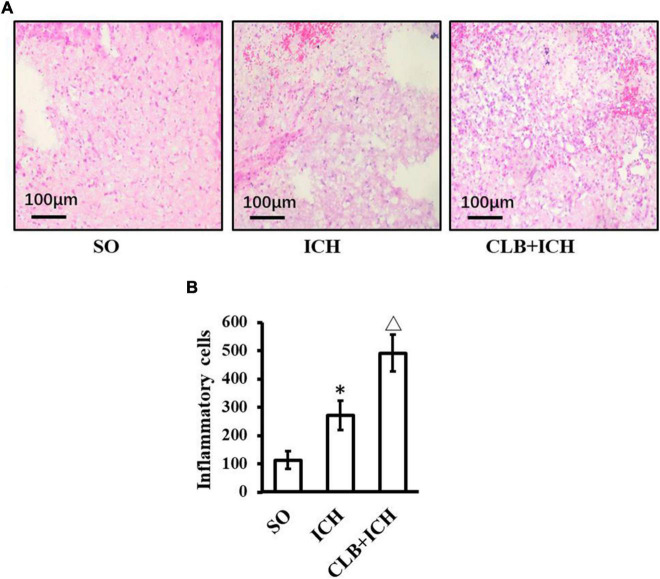
HE staining result of three groups. (A) Histopathological changes in perihematomal tissues of each group 3 days after ICH induction (HE staining, ×400). In the SO group, cerebral hematoma, edema, and liquefactive necrosis were not found. In the ICH group, tissues surrounding the cerebral hematoma showed edema, liquefactive necrosis, deposition of hemosiderin, inflammatory cells (mainly neutrophils). In the CLB + ICH group, there was greater edema and higher infiltration of immune cells (predominant monocytic and a low-degree neutrophilic granulocyte) in the perihematomal region compared to that in ICH group. Scale bar: 100 μm. (B) The number of inflammatory cells in the ICH group was significantly higher than those in control group (∗P < 0.05). Compared to ICH groups, numbers of inflammatory cells in CLB + ICH group was further increased (△, P < 0.05). SO group, n = 5; ICH group, n = 5; and CLB + ICH group, n = 5.

