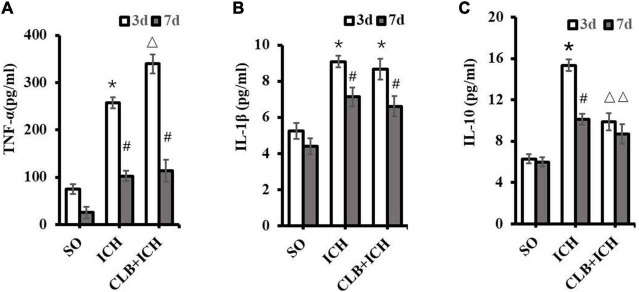
FIGURE 6.
Levels of TNF-α, IL-1β, and IL-10 in the perihematoma tissue using ELISA. (A) Compared to SO group, TNF-α significantly increased in ICH and CLB + ICH groups (*P < 0.05) 3 days after ICH. The levels of TNF-α expression 7 days after ICH decreased significantly compared to the levels at day 3 days, in the ICH and CLB + ICH groups (#, P < 0.05). Compared to that in ICH group, TNF-α was significantly up-regulated in the CLB + ICH group 3 days after ICH (△, P < 0.05). There were no statistical difference between ICH group and CLB + ICH group 7 days after ICH. (B) The expression levels of IL-1β in both ICH and CLB + ICH groups were significantly higher compared to the SO group (*P < 0.05). IL-1β was significantly decreased 7 days after ICH compared to 3 days after ICH in the ICH and CLB + ICH groups (#, P < 0.05). There were no statistical differences in the levels of IL-1β between ICH group and CLB + ICH group 3 and 7 d after ICH (P > 0.05). (C) The expression levels of IL-10 in the CLB + ICH group were significantly lower than those in the ICH group 3 and 7 d after ICH (△, P < 0.05). There was a statistically significant decrease in the expression levels of IL-10 in the ICH group between 3 and 7 d after ICH (#, P < 0.05). However, the levels were only slightly decrease in the CLB + ICH group (P > 0.05). SO group, n = 5. ICH group, n = 5; and CLB + ICH group, n = 5, 3, or 7 days after ICH.

