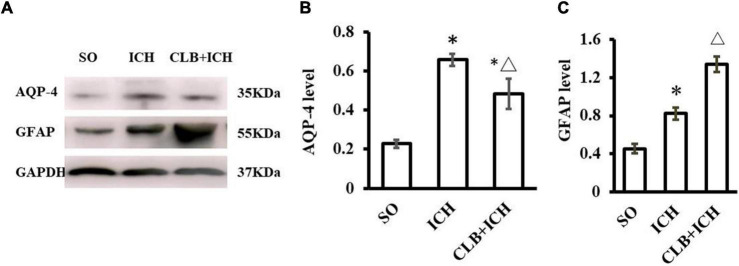
FIGURE 7.
Western blot results of AQP4 and glial fibrillary acidic protein (GFAP) of three groups 3 d after ICH. (A) Representative result of Western Blot. (B) The expression of AQP4 in the ICH and CLB + ICH groups was significantly higher compared to SO group (∗P < 0.05). AQP-4 level was significantly decreased in the CLB + ICH group compared to the ICH group (△, P < 0.05). (C) The expression of GFAP was significantly increased in the ICH and CLB + ICH group as compared to the SO group (∗P < 0.05). The expression of GFAP was further increased in the CLB + ICH group compared to that in ICH group (△, P < 0.05). SO group, n = 5; ICH group, n = 5; and CLB + ICH group, n = 5.

