
Figure 7.
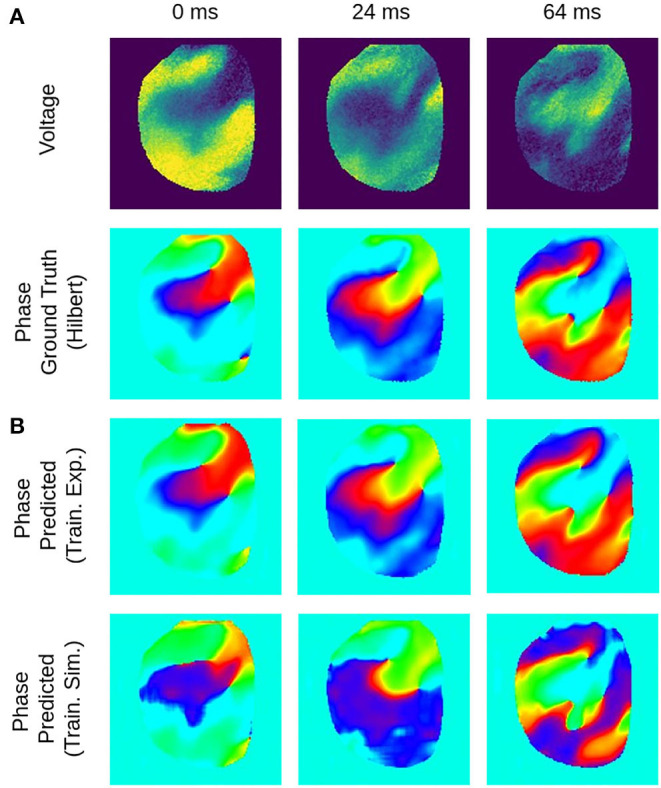
Deep learning-based phase mapping of VF in rabbit heart with neural network trained on either experimental or simulation data. (A) Voltage-sensitive normalized optical maps showing action potential vortex waves during VF on rabbit heart and corresponding ground-truth phase maps computed using the Hilbert transform. (B) Prediction of phase maps using neural network model M1 trained with either rabbit optical mapping data (top, data not seen during training) or solely simulated data (bottom) of excitation spiral wave chaos (noise σ = 0) as shown in Figure 4A but masked as in Figure 4B. The phase prediction accuracy is 97±6% and 94±11% when training is performed with experimental or simulation data, respectively, see also Figure 8 for a comparison of prediction accuracies when training across different species.