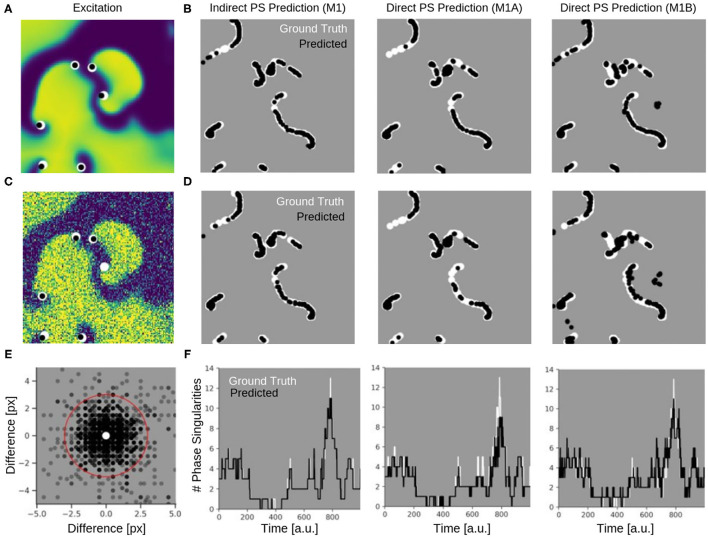
Figure 9.
Phase singularities (PS) predicted for neural networks M1 (indirect PS prediction, computing of PS from phase prediction), M1A (pixel-wise cross-entropy loss), and M1B (weighted Hausdorff distance loss) from simulated maps of electrical excitation. White: ground-truth or true PS. Black: predicted PS. A quantitative evaluation of the predicted PS is shown in Table 1. (A) Electrical spiral wave chaos without noise with PS superimposed indicating positions of spiral wave tips for model M1A. (B) Trajectories of ground truth (white) and predicted (black) PS without noise over 60 simulation time steps for the models M1, M1A, and M1B. (C) Electrical spiral wave chaos with noise (σ = 0.3) with PS superimposed indicating positions of spiral wave tips. (D) Trajectories of ground truth and predicted PS with noise. Increase in false negative predictions with noise. Model M1B also produces false positive detections. (E) Spatial mismatch of predicted PS (black) and ground truth PS (white, center) for model M1A. All predicted PS not within 3 pixels (red circle) from true PS are false positives. (F) Number of PS over time predicted with models M1, M1A, M1B from electrical spiral wave chaos with noise (σ = 0.3).

