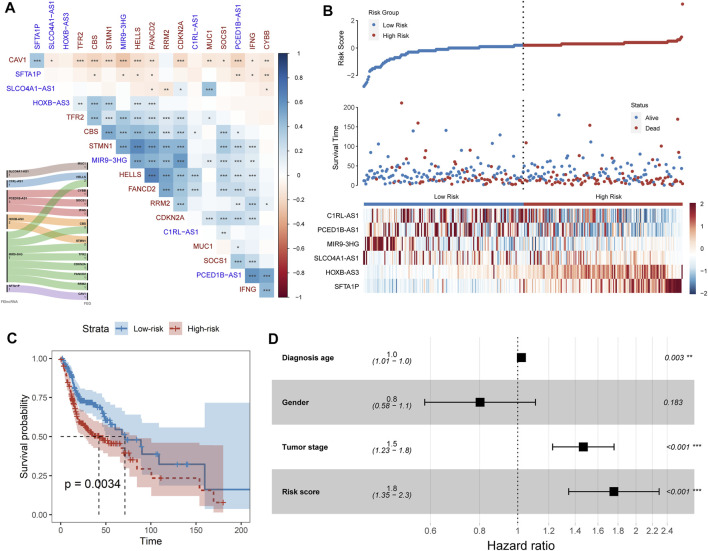
FIGURE 2.
FElncRNAs indicated the prognosis values in HNSCC. (A) Heatmap showing the Spearman’s correlation between FElncRNAs and FEGs. (B) Risk score distribution, survival status, and lncRNA expression patterns for patients in high- and low-risk groups by the PFLS. (C) Kaplan–Meier curve of HNSCC cancer samples stratified by the risk group with the log-rank test p-value provided. (D) Forest plot showing the result of multivariate Cox regression analysis for correlation between the PFLS and clinical features and the overall survival in the TCGA cohort.

