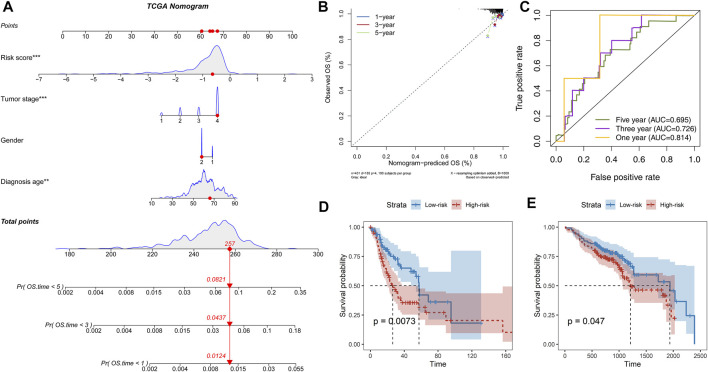
FIGURE 3.
PFLS was an independent prognosis factor in HNSCC. (A) Nomogram composed of age, gender, stage, and risk score for the prediction of 1-, 3-, and 5-years OS probability. (B) Calibration for assessing the consistency between the predicted and the actual OS at 1, 3, and 5 years. (C) ROC curves at one, three, and five years were applied to verify the prognostic performance of the PFLS in the TCGA training set. D-E. The Kaplan–Meier curve of HNSCC cancer samples stratified by the risk group with the log-rank test p-value provided in (D) TCGA test set and (E) GSE65858.

