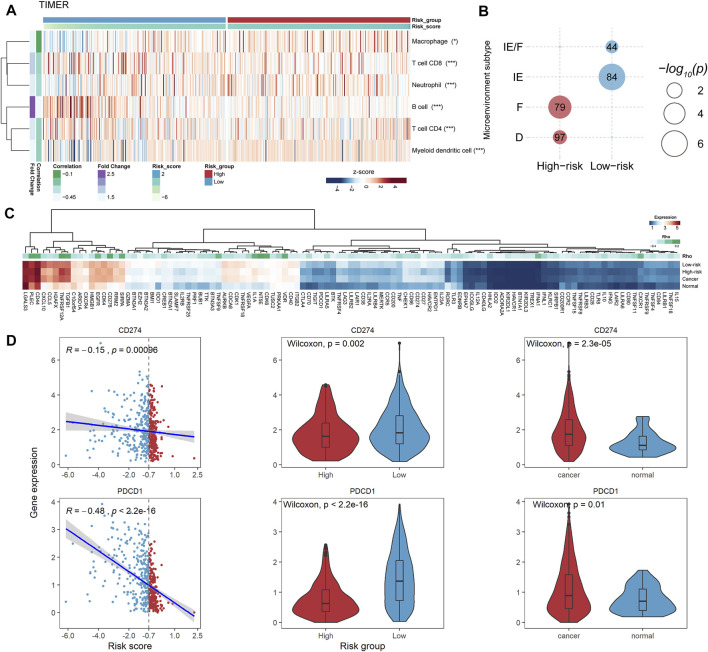
FIGURE 5.
PFLS-risk groups were associated with the tumor immune microenvironment. (A) Heatmap showing the tumor immune cell infiltration levels assessed by TIMER. The Spearman’s correlation significance between cell abundance and the risk score was also computed for each cell shown on the right (*p < 0.05, **p < 0.001, and ***p < 0.0001). (B) Bubble plot showing the significant enrichment between HNSCC microenvironment subtypes and risk groups. (C) Heatmap showing the expression levels of PFLS-related ICPs. D. CD274 and PDCD1 were closely associated with the PFLS risk score. *p < 0.05, **p < 0.001, and ***p < 0.0001 as calculated using the (B) accumulative hypergeometric distribution, (C) Spearman’s correlation test.

