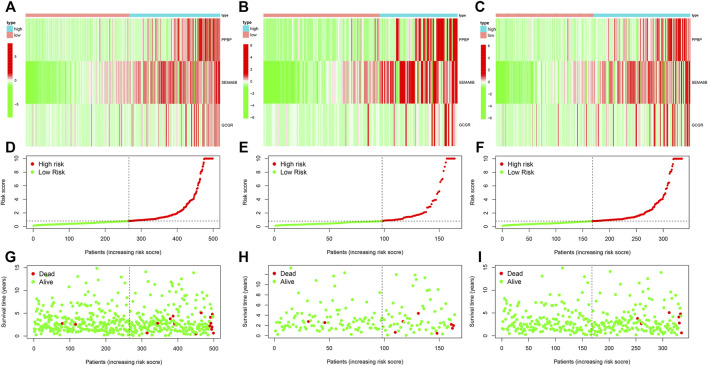
FIGURE 5.
Construction of THCA prognostic model (A–C) Expression levels of three prognostic hub IRDEGs among THCA patients in the combined test, and training cohorts, respectively. (D–F) The distribution of RS among THCA patients in three cohorts. (G–I) The survival status correlated with RS among THCA patients. THCA, thyroid carcinoma; RS, risk score.

