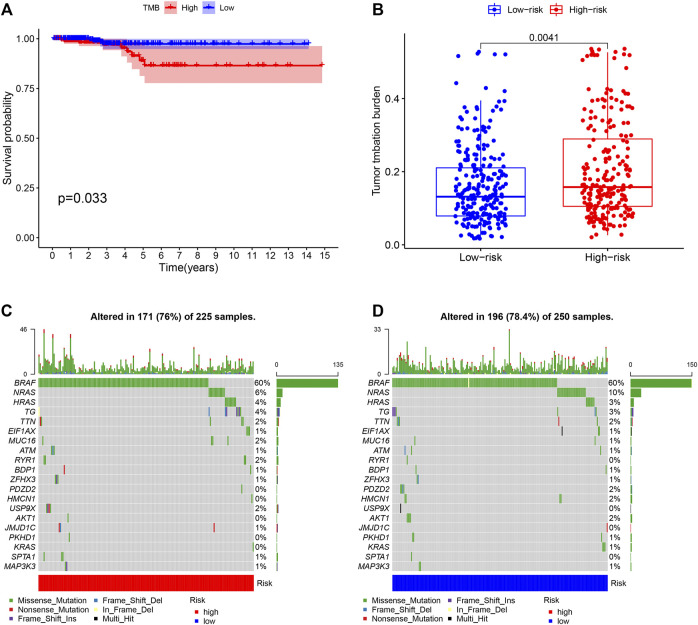
FIGURE 8.
Association of TMB with OS and RS (A) Survival analysis of THCA patients with high- and low-TMB (B) Comparisons of TMB in low- and high-RS groups (C) (D) Waterfall plot for mutation profiles of the top 20 genes in THCA samples of high- and low-RS groups, respectively. Annotations with different colors at the bottom referred to the various mutation types and bar chart above presented mutation burden. The right showed name of mutated genes and the right displayed percent of gene mutation. TMB, tumor mutation burden; OS, overall survival; RS, risk score.

