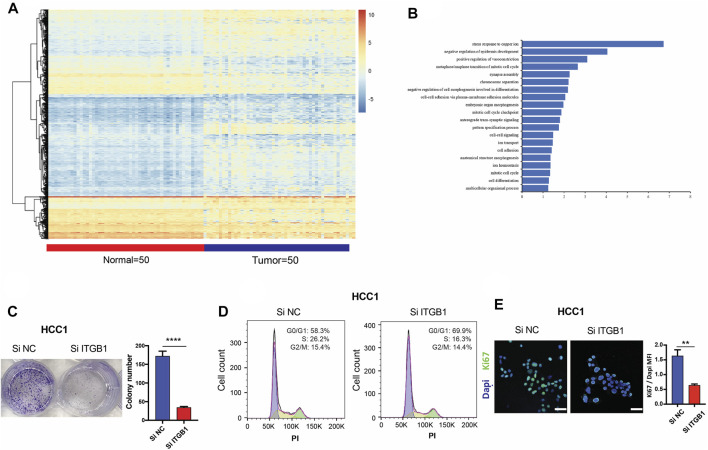
FIGURE 4.
ITGB1 promoted the progression of HCC by facilitating mitotic cell cycle. (A) Heatmap of differentially expressed genes in LIHC patients (n = 50) and normal samples (n = 50) derived from TCGA data. (B) TBtools software was used for functional enrichment analysis of differentially expressed genes derived from TCGA data, whose significance threshold of p-value was less than 0.05. (C) Representative images (left) and quantification (right) of colony formation assays for the measurement of proliferation of HCC1 cells treated with ITGB1 siRNA after 6 days. (D) Cell cycle distribution of HCC1 cells treated with ITGB1 siRNA was determined by flow cytometry with propidium iodide staining. (E) Representative images (left) and quantification (right) of Ki67 expressed in HCC1 cells treated with ITGB1 siRNA after 3 days. Samples were probed by anti-Ki67 (green) Ab and counterstained by DAPI (blue). Scale bar = 50 µm. Values are presented in mean ± SD. **p < 0.01, ****p < 0.0001.

