FIGURE 8.
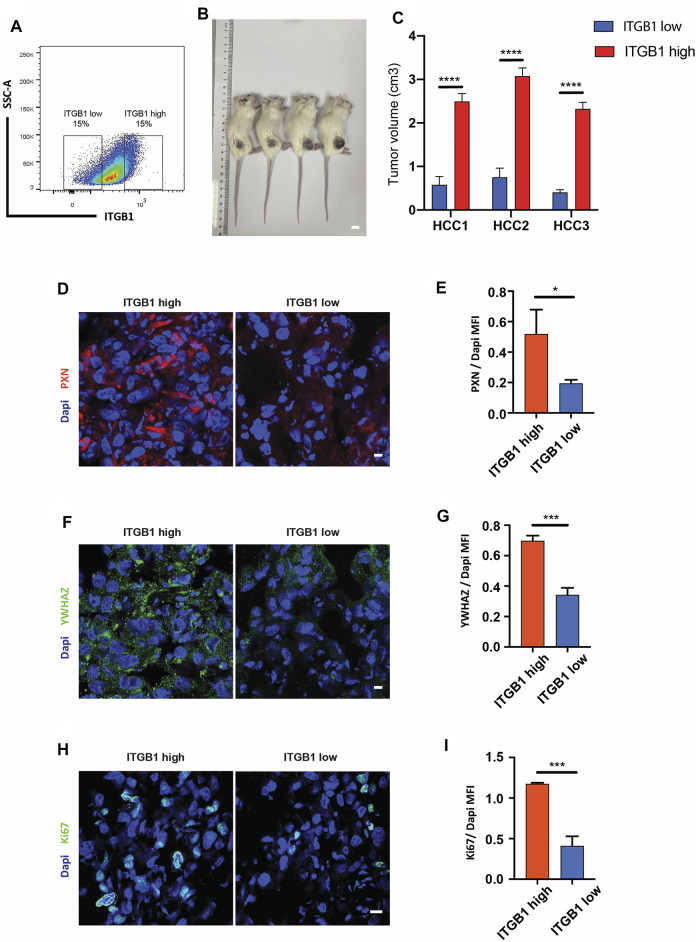
ITGB1 expression modulated HCC tumor growth in vivo. (A) Gating strategy for isolating ITGB1high and ITGB1lowcells from HCC cells. (B) Representative images of subcutaneous tumors formed by ITGB1low or ITGB1high HCC1 cells in mice. Scale bar = 1 cm. (C) The quantification of tumor volume of subcutaneous tumors of HCC cells (n = 5 per group). (D) Representative confocal images of PXN in tissues from ITGB1high and ITGB1low HCC1 cell-formed tumors. Scale bar = 100 µm. (E) The quantification of the protein expression of PXN by immunostaining analysis. Samples were probed by anti-PXN (red) Ab and counterstained by DAPI (blue). (F) Representative confocal images of YWHAZ in tissues from ITGB1high and ITGB1low HCC1 cell-formed tumors. Scale bar = 100 µm. (G) The quantification of protein expression of YWHAZ by immunostaining analysis. Samples were probed by anti-YWHAZ (green) Ab and counterstained by DAPI (blue). (H) Representative confocal images of Ki67 in tissues from ITGB1high and ITGB1low HCC1 cell-formed tumors. Scale bar = 100 µm. (I) The quantification of the protein expression of Ki67 by immunostaining analysis. Samples were probed by anti-Ki67 (green) Ab and counterstained by DAPI (blue). Values are presented in mean ± SD. *p < 0.05, ***p < 0.001, ****p < 0.0001.

