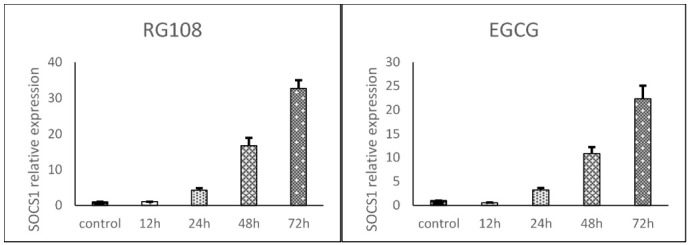
Fig. 2.

SOCS1 expression in RG108 and EGCG -treated U937 cells relative to controls at 12, 24, 48, and 72 h as determined by real-time PCR. SOCS1 expression was normalized to GAPDH. Statistical significance was determined by ANOVA and the post-hoc Tukey test. Data are reported as means±SEMs.
