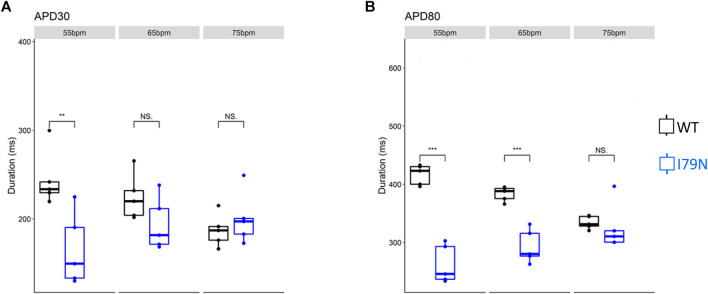
FIGURE 2.
Influence of stimulation frequency on action potential duration in WT (black) and I79N+/− (blue) TNNT2 hiPSC-CMs. (A, B) The data at APD30 and APD80, respectively. The box plots exhibit the impact of increasing the stimulation frequency from 55 to 75 bpm on these parameters. The two groups, WT vs. I79N+/−, were compared using unpaired Student’s t tests with n = 5 biological and n = 2 technical replicates per condition. A p value <0.05 was considered statistically significant with the following notation: *p < 0.05, **p < 0.01, and ***p < 0.001.

