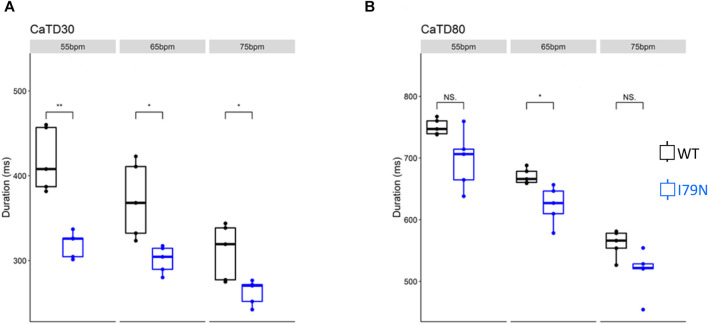
FIGURE 3.
The influence of stimulation frequency on Ca2+ transient duration in WT (black) and I79N+/− (blue) TNNT2 hiPSC-CMs. (A, B) The data at Ca2+ transient durations of CaTD30 and CaTD80, respectively. The box plots exhibit the impact of increasing the stimulation frequency from 55 to 75 bpm on these parameters. I79N+/− hiPSC-CMs exhibited a significantly shorter CaTD30 than WT under all conditions and significantly shorter CaTD80 at 65 bpm. The two groups, WT vs. I79N+/−, were compared statistically using unpaired Student’s t tests with n = 5 biological and n = 2 technical replicates per condition. A p value <0.05 was considered statistically significant with the following notation: *p < 0.05, **p < 0.01, and ***p < 0.001.

