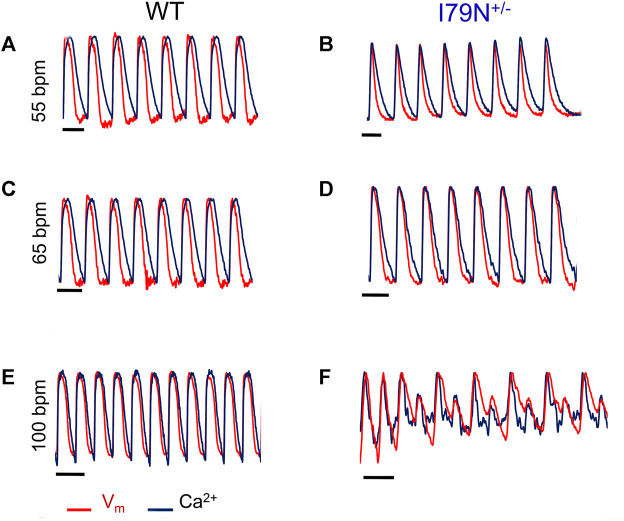
FIGURE 5.
Representative optical mapping traces of voltage (V m—red) and Ca2+ transients (blue) in hiPSC-CMs stimulated at different frequencies. Monolayers of hiPSC-CMs WT and I79N+/− TNNT2 were loaded with voltage- (RH-237) and Ca2+-dependent (Rhod-2AM) dyes and optically mapped while being field stimulated at 55 bpm (A, B), 65 bpm (C, D), and 100 bpm (E, F) for 20 s each. The TNNT2 WT hiPSC-CMs exhibited clear and significant shortening in the duration of both the action potential and Ca2+ transients as a function of stimulation frequency [(A) vs. (E)] while I79N+/− hiPSC-CMs did not. Furthermore, as the stimulation frequencies reached 100 bpm, the hiPSC-CMs harboring the I79N+/− variant clearly displayed irregular voltage and Ca2+ transients (F), which were never observed in WT hiPSC-CMs. Moreover, eight irregular voltage and Ca2+ transients were recorded over the 20-s interval (n = 5 biological and n = 2 technical replicates for each group).

