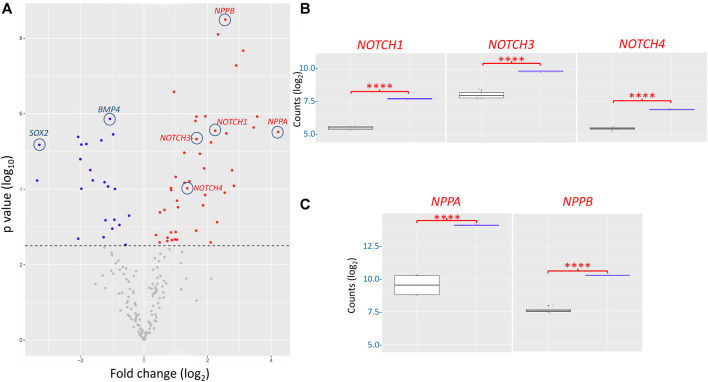
FIGURE 7.
Transcriptomic analysis of the impact of the TNNT2 I79N+/− variant vs WT using a custom Nanostring codeset of 251 transcripts. (A) Volcano plot of I79N vs WT TNNT2 transcriptomic analysis. From 68 differentially expressed genes (DEG) (adjusted p < 0.05), 23 were downregulated (blue) and 45 were upregulated (red). (B) The significantly upregulated NOTCH signalling pathway transcripts are shown individually shown in box plots. (C) The significantly upregulated cardiac hypertrophy markers ANP (NPPA) and BNP (NPPB) are shown in box plots. For each gene count, the data were normalized against the housekeeping genes, and are presented in log2 scale. The fold-change of each gene was compared between the WT (n = 4) vs. I79N+/− (n = 3) TNNT2 hiPSC-CMs using Welch’s t-test and was corrected for multiple comparisons using the Benjamini–Yekutieli method to calculate the false discovery rate (FDR). ****p < 0.001.

