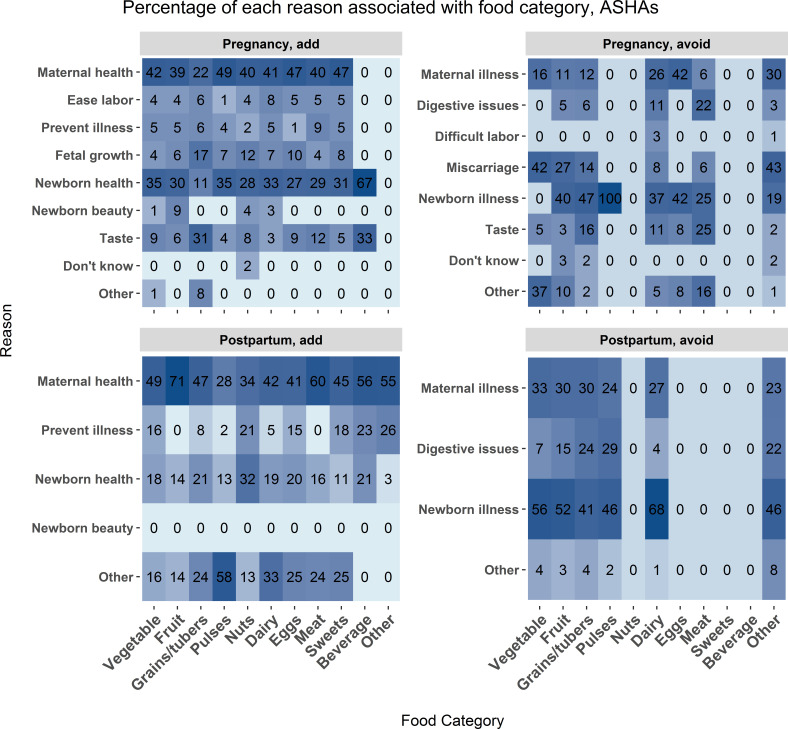
Figure 4.
Mother data. The frequency of association between food category and food choice explanation measured as a percent of total mentions for each food category. The associations are broken down by foods added during pregnancy (upper left), avoided during pregnancy (upper right), added post partum (lower left), and avoided post partum (lower right). Each cell represents the percent of times a reason was associated with each food category. Darker blue shading indicates a higher percentage of mentions. Influencer category codes, y-axis: AWW ANM - Anganwadi Worker or Auxiliary Nurse Midwife; ASHA - Accredited Social Health Activist; FrRelNeigh - friends/relatives/neighbours; GovDoc - government doctor; PrivClinic - private clinic; RMP - Rural Medical Practitioner; SHG - self- help group.

