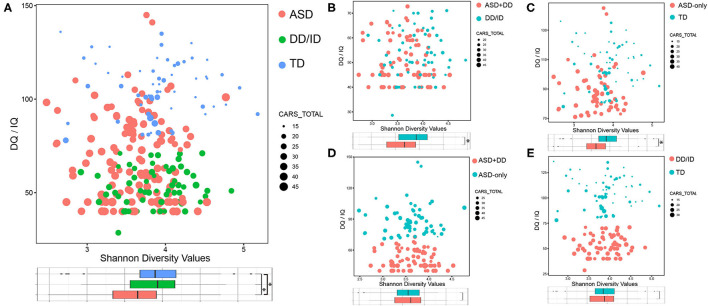
Figure 2.
Bacterial richness and diversity comparison according to the Shannon index depicted with IQ/DQ and CARS total scores. The size of node is proportional to the number of CARS total scores. The color of node indicates different groups. *p < 0.05. (A) ASD vs. DD/ID vs. TD. (B) ASD+DD vs. DD/ID. (C) ASD-only vs. TD. (D) ASD+DD vs. ASD-only. (E) DD/ID vs. TD. ASD, autism spectrum disorder; DD/ID, developmental delay or intellectual disability; TD, typically developing; CARS, Childhood Autism Rating Scale.

