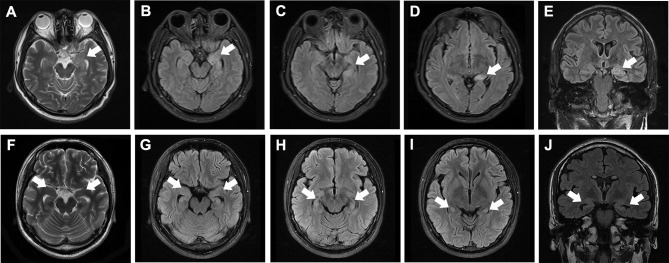
Figure 1.
Typical MRI of anti-LGI1 encephalitis patients. (A–E) MRI of a patient at 1 month after disease-onset, showing high T2 (A) and T2/FLAIR [(B–D axial, (E) coronal] signals in the left hippocampus (white arrows). (F–J) MRI of a patient at 6 months after disease-onset, showing moderately elevated T2 (A) and T2/FLAIR [(B–D) axial, (E) coronal] signals in both hippocampi (white arrows) as well as bilateral hippocampal atrophy.

