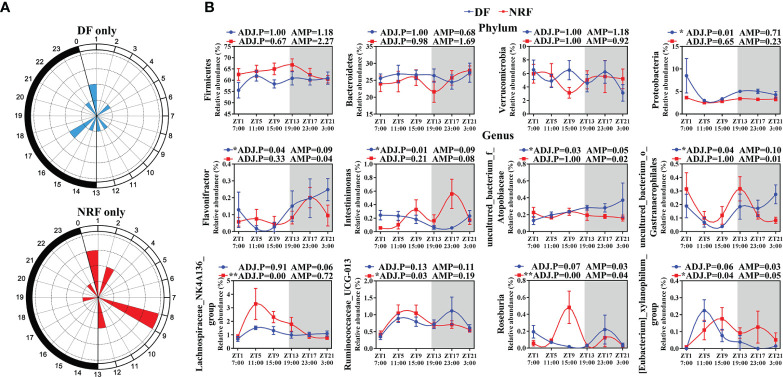
Figure 3.
The diurnal rhythm of gut microbiome phyla and genus under different feeding time regimens. (A) Polar plot represents the number of rhythmic ASVs with an estimated peak value for each time as determined by JTK analysis. The radius of black concentric circles indicates the number of rhythmic ASVs, and the minimum radius of the black concentric circle represents one ASV. The black arc on the left side of the polar plot indicates the day/night cycle. (B) The diurnal rhythm of gut microbiome at phylum and genus level (n = 6 per time point), data are shown as the mean ± SEM. White boxes indicate daytime and gray boxes indicate nighttime. ADJ.P for adjusted minimal p-values, ADJ.P < 0.05 indicates significant diurnal rhythm, AMP represents amplitude. DF, daytime feeding; NRF, night-restricted feeding. *ADJ.P < 0.05; **ADJ.P < 0.01.

