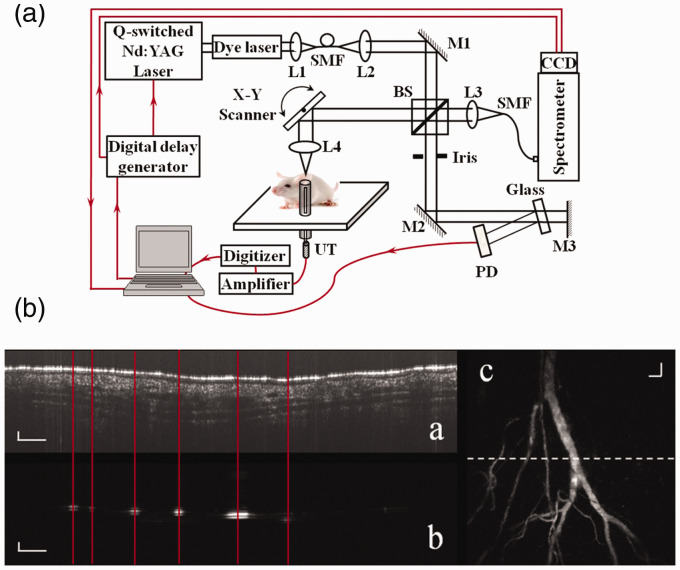
Figure 2.
Schematic of the experimental system of a free-space OC-PAM (a) and images simultaneously acquired from a mouse ear in vivo (b). L1–L4: lens; BS: beam splitter; SMF: single mode fiber; PD: photodiode; UT: ultrasonic transducer; M1, M2: mirror. In (b), (a) OCT B-scan image; (b) PAM B-scan image; (c) maximum-amplitude-projection (MAP) of the 3D PAM dataset. Bar: 100 µm. 23 (A color version of this figure is available in the online journal.)

