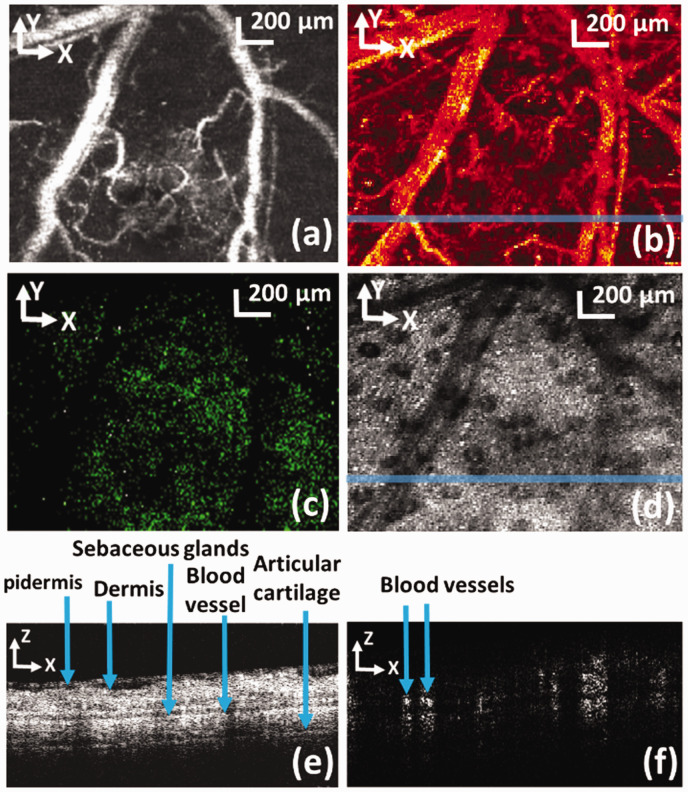
Figure 5.
PAM (a: maximum amplitude projection), CFM (c), OCT (d: en face view, e: B-scan), and OCTA (b: en face view, f: cross-sectional) images acquired in the same ROI of a mouse ear. The locations of the cross-sectional images are marked in the corresponding en face views by solid lines. Bar: 200 mm. 39 (A color version of this figure is available in the online journal.)

