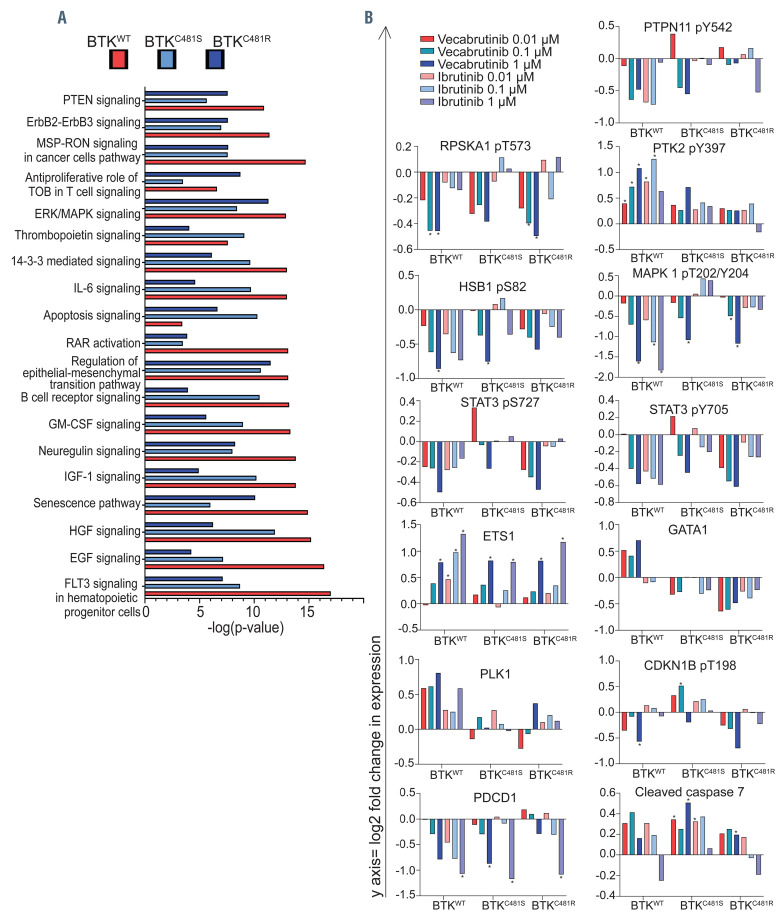
Figure 2.
Effect of vecabrutinib treatment on functional protein profiles of wild-type and mutant BTK-overexpressing MEC-1 cells. (A) Effect of vecabrutinib on common pathways in all three cell lines. Exponentially growing MEC-1 cells with either wild-type or mutant BTK were treated for 24 h with vecabrutinib at 1 mM. Experiments were performed in biological triplicates (n=3/cell line). At the end point, cells were collected, and protein was extracted and was subjected to the reverse-phase protein array (RPPA) that included 258 antibodies. Changes in expression (RPPAtreatment[1 mM]-RPPADMSO) values were used to determine the top canonical pathways identified with Ingenuity Pathway Analysis and associated with BTKWT (red bars), BTKC481S (light blue bars), and BTKC481R (navy blue bars) cells. (B) Effect of vecabrutinib treatment on proteins in wild-type and mutant BTK-overexpressing MEC-1 cells. Exponentially growing MEC-1 cells with either wild-type or mutant BTK were treated with three concentrations of vecabrutinib or ibrutinib and then their proteins were extracted and subjected to RPPA assays as described in the Methods section. Graphs were generated using the log2 fold change in expression (RPPAtreatment-RPPADMSO) values obtained by analysis of the RPPA data. Legends used in all graphs in Figure 2B are included in the upper left corner. Gene names and phosphorylation sites are indicated on top of each figure. Statistical comparisons were made between dimethylsulfoxide (DMSO)- versus ibrutinib- or vecabrutinib-treated cells, and asterisks depict P values <0.05.

