Figure 2.
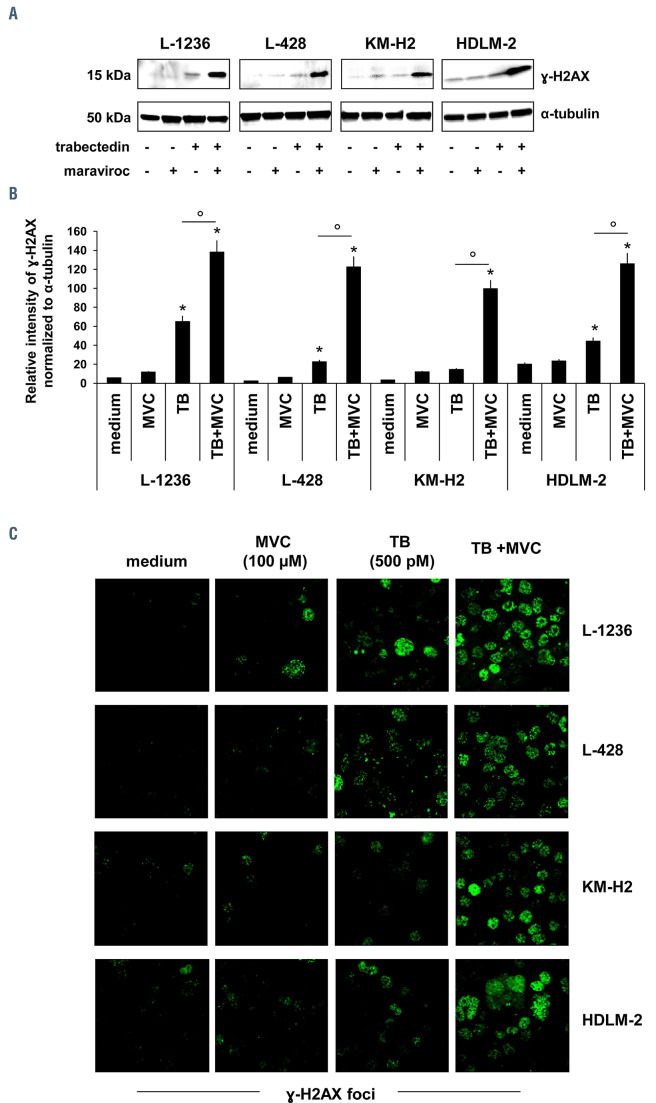
Maraviroc enhanced DNA damage induced by trabectedin. Hodgkin and Reed-Sternberg (HRS) cells were treated with maraviroc (100 mM), trabectedin (500 pM) and their combination for 24 h. (A) Western blot for g-H2AX and a-tubulin protein expression in cHL cell lines. Membrane strips were incubated with mouse anti-phospho-histone H2A.X (Ser139) (clone JBW301) (Millipore) and mouse anti-a-tubulin antibody clone B-5-1-2 (Sigma Aldrich) and revealed with donkey anti-mouse IgG (H+L chain) A90-137P (Bethyl Laboratories). Images were acquired using a ChemiDoc XRS system (Bio-Rad). Data are representative of four experiments. (B) Bar charts showing densitometric analysis of g-H2AX expression normalized to a-tubulin as a loading control. Protein quantification was performed using ImageJ software. Values are means and standard deviation of four experiments. *P<0.05, treatments vs. control, One-way analysis of variance followed by the Dunnett test. °P<0.05, trabectedin vs. trabectedin and maraviroc in combination, Student t-test. (C) Immunofluorescence images (confocal microscopy) of g-H2AX foci after drug treatment. HRS cells adherent to coverslips, were fixed, permeabilized and incubated with anti-phospho-histone H2A.X (Ser139) (clone JBW301) (Millipore), followed by Alexa Fluor-488 anti-mouse secondary antibody (Thermo Scientific). Images were acquired with a Leica TCS SP8 Confocal system (Leica Microsystems Heidelberg, Mannheim, Germany), using Leica Confocal Software (LCS). MVC: maraviroc; TB: trabectedin.

