Figure 1.
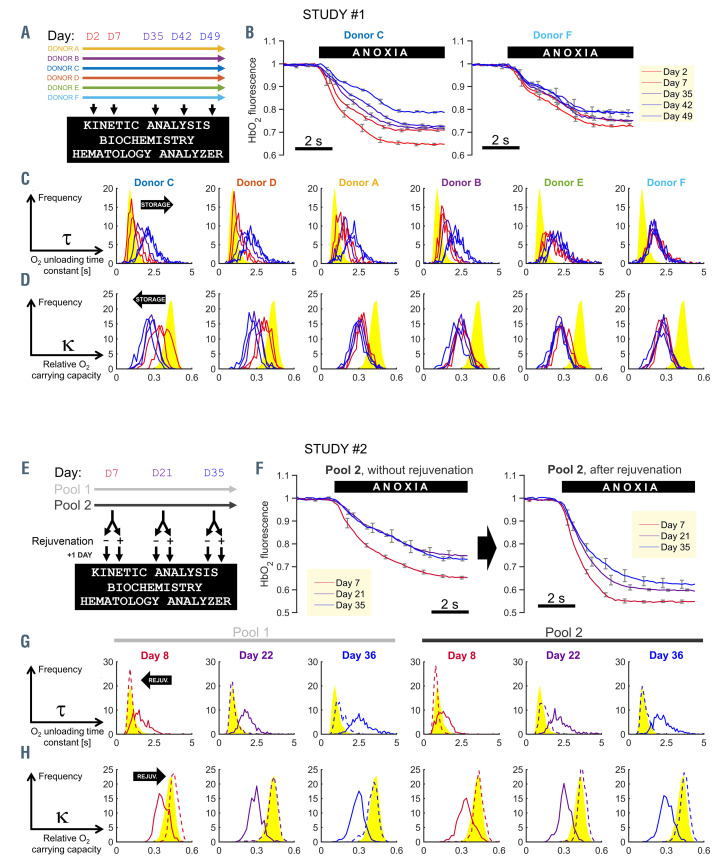
The kinetics of O2 handling in red cell concentrates are dependent on storage duration and donor, and can be normalized with rejuvenation treatment. (A) The protocol of study #1 showing color-coding for donors and indicating the days at which red cell concentrates (RCC) were sampled for analyses. (B) Example time course of HbO2 saturation in response to a rapid solution maneuver that reduces extracellular O2 tension to anoxic levels. Measurements on RCC from donor C (left) or F (right) at days 2, 7, 35, 42 and 49 of storage. Each line represents the mean of ten red blood cells (RBC); error bars are the standard deviation (SD). (C) Histograms of O2-unloading time constant t grouped by donor, and plotted for storage days 2, 7, 35, 42 and 49 (red transitioning to blue as storage duration increases). Each histogram was constructed from at least 300 RBC. Reference data from freshly collected venous blood are shown in yellow. (D) Frequency histograms of O2-carrying capacity k. (E) The protocol of study #2 showing color-coding for RCC pools #1 and #2 and days at which biochemical rejuvenation and analyses were performed. (F) Example time course of HbO2 saturation response to anoxia (mean±SD of ten cells from RCC pool #2). (G) Histograms of t, color-coded by storage duration (red to blue). Dashed lines denote measurements from rejuvenated units. Each histogram was constructed from a total of at least 300 RBC. Reference data from freshly collected venous blood are shown in yellow. (H) Frequency histograms of k.

