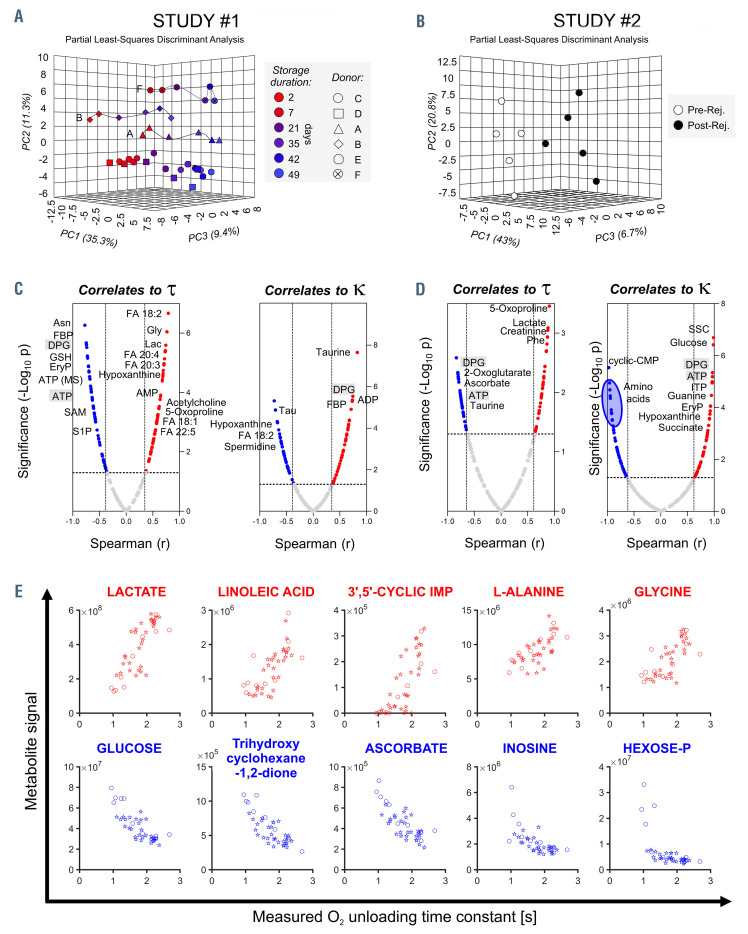
Figure 3.
Metabolomic analyses of red cell concentrates under storage and after rejuvenation identify correlates to O2-handling kinetics. (A) Mass spectrometry analyses (MetaboAnalyst) of red cell concentrates (RCC) from study #1. Partial least square-discriminant analysis (PLS-DA) indicates a significant impact of storage duration and inter-donor variability on metabolic phenotypes. Metabolites with the highest loading weights in principal components (PC) 1 and 2 were affected by storage duration across all samples (~35% of the total variance) and biological variability between donors (~11%). (B) Metabolomic analyses of RCC before and after rejuvenation. Rejuvenation had a significant impact on metabolites with the highest loading weights in PC1 (43%). (C,D) Metabolic correlates (Spearman test) to t or k for units under study #1 (C) and study #2 (D). Metabolites-of-interest are highlighted. These include 5-oxoproline and lactate as correlating positively with t; C18/20 free fatty acids (e.g. linoleic) as correlating positively with t and negatively with k; fructose 1,6-bisphosphatase (FBP) and inosine triphosphate (ITP; in rejuvenated pools, possibly a result of the inosine boost), the pentose phosphate metabolite erythrose 4-phosphate (EryP) and sphingosine 1-phosphate (S1P), dicarboxylates (2-oxoglutarate, fumarate, succinate, malate), ascorbate/dehydroascorbate, and the amino acids taurine and phenylalanine (Phe) as correlating negatively with t. DPG: 2,3-diphosphoglycerate; FA: fatty acid; Gly: glycine; Lac: lactate; SAM, S-adenosyl methionine. (E) Top five metabolites correlating positively (top, red) and negatively (bottom, blue) with t, using data from study #1 (circles) and study #2 (stars). These correlations were equal to or better than for [2,3-DPG].

