Figure 1.
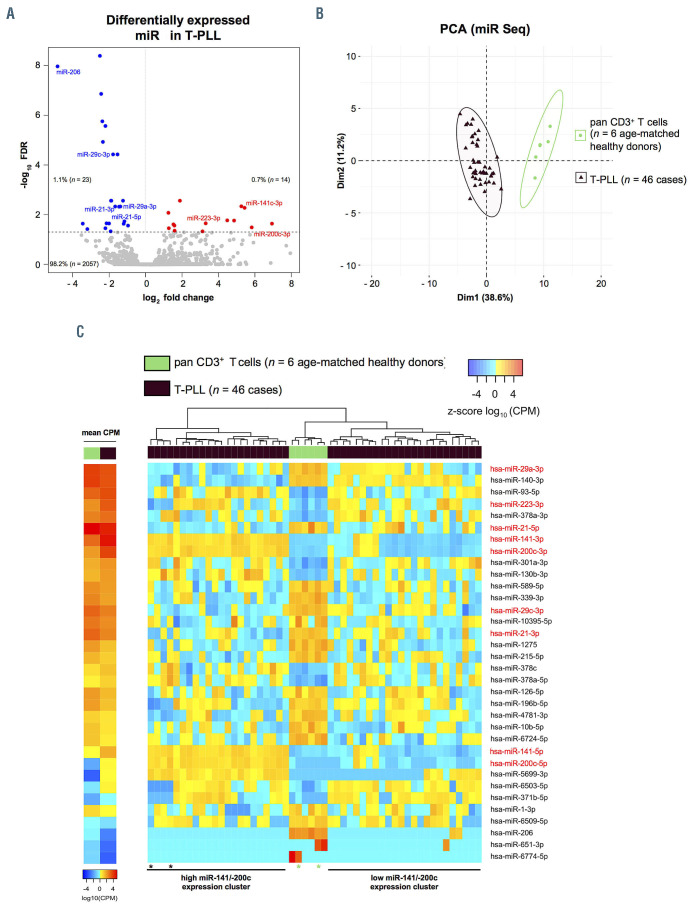
Global microRNA-deregulations highlight differential expression of miR-141 and miR-200c clusters in T-cell prolymphocytic leukemia. (A) MicroRNA (miR) profiles were evaluated using small-RNA sequencing of primary human peripheral blood-derived T-cell prolymphocytic leukemia (T-PLL) cells (n=46 cases) and CD3+ healthy donor-derived pan-T cell controls (n=6 donors). Volcano plot showing fold changes (fc) and false discovery rates (FDR) of all identified miR (n=2,094). Differentially expressed miR (n=37, Online Supplementary Table S1) are highlighted in blue (downregulation) and red (upregulation). Relative proportions are based on all identified miR. (B) Principle component analysis (PCA) based on miR differentially expressed comparing T-PLL cases (n=46) to healthy donor controls (n=6). Separate clustering of cases and controls indicates global differences in miR expression profiles. (C) Heatmaps of differentially expressed miR (n=34; FDR<0.05) in T-PLL samples vs. CD3+ pan-T cells of healthy donors. Left two-column heatmap: mean counts per million (CPM) values compared between healthy donor controls (n=6) and T-PLL (n=46; red=higher expression; blue=lower expression). Right heatmap: colors represent z-scores of respective CPM values calculated for each miR (red=higher z-score; blue=lower z-score). Control samples with slightly lower purities (77% and 85%) and T-PLL cases presenting a rather unique transcriptome, which clusters closer to control T cells (Online Supplementary Figure S4C), are indicated by asterixis (brown: T-PLL cases; green: control cases).

