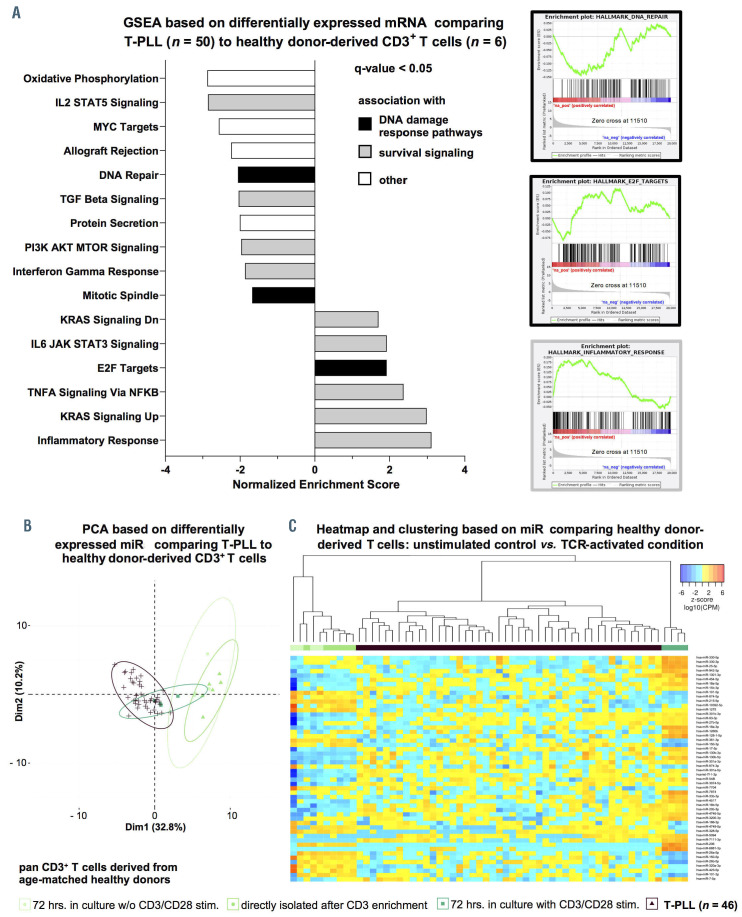
Figure 2.
Global alterations of T-cell prolymphocytic leukemia microRNA expression signatures/ transcriptome networks resemble those of T-cell receptor-activated T cells. (A) Gene set enrichment analysis (GSEA) of differentially expressed mRNA in T-cell prolymphocytic leukemia (T-PLL) using HALLMARK gene sets (n=948 genes, Online Supplementary Table S6; Online Supplementary Figure S5; total n=48 gene sets). Gene expression profiles were assessed using global mRNA sequencing of primary TPLL cells (n=48 cases) and healthy donor-derived CD3+ pan-T cells (n=6 donors). Color code represents assignment to dysregulation to either altered DNA damage response pathways (black) or prosurvival signaling (grey). Exemplary GSEA plots are presented (DNA REPAIR: normalized enrichment score [NES]=-2.18, q=0.008, E2F TARGETS: NES=2.05, q=0.01, INFLAMMATORY RESPONSE: NES=3.12, q<0.0001). (B and C) T-PLL miR-omes resembled those of activated healthy donor T cells: age-matched healthy donor-derived peripheral blood mononuclear cells (PBMC) were isolated via density gradient centrifugation. T-cell activation was achieved via antibody-mediated CD3/CD28 crosslinking. After 72 hours (hrs), CD3+ primary T cells were isolated by magnetic-activated cell sorting (MACS) (negative selection; see Method section for details; cell purities are given in Online Supplementary Figure S6A, see Online Supplementary Figure S6B and C for control experiments on stimulation). MiR profiles were generated using small-RNA sequencing. Unstimulated cultured controls clustered together with directly isolated control samples, indicating that there was a negligible cell culture effect on miR expression profiles. Color code: T-PLL in brown, controls in green colors (light green: CD3+ T cells cultured in vitro for 72 hrs. without stimulation; green: CD3+ T cells submitted to miR-ome sequencing directly after enrichment; dark-green: CD3+ T-cell cultures at 72 hrs. subsequent to T-cell receptor [TCR] activation). (B) PCA based on differentially expressed miR comparing T-PLL to healthy donor-derived T cells (n=37 miR, Online Supplementary Table S1). TCR-activated healthy donor-derived T cells clustered with T-PLL cases. (C) Heatmap and clustering based on differentially expressed miR comparing healthy donor-derived T cells: unstimulated controls versus TCR-activated condition (n=56 miR, FDR<0.05). Colors represent z-scores of CPM values calculated for each miR (blue=lower z-score; red=higher z-score).

