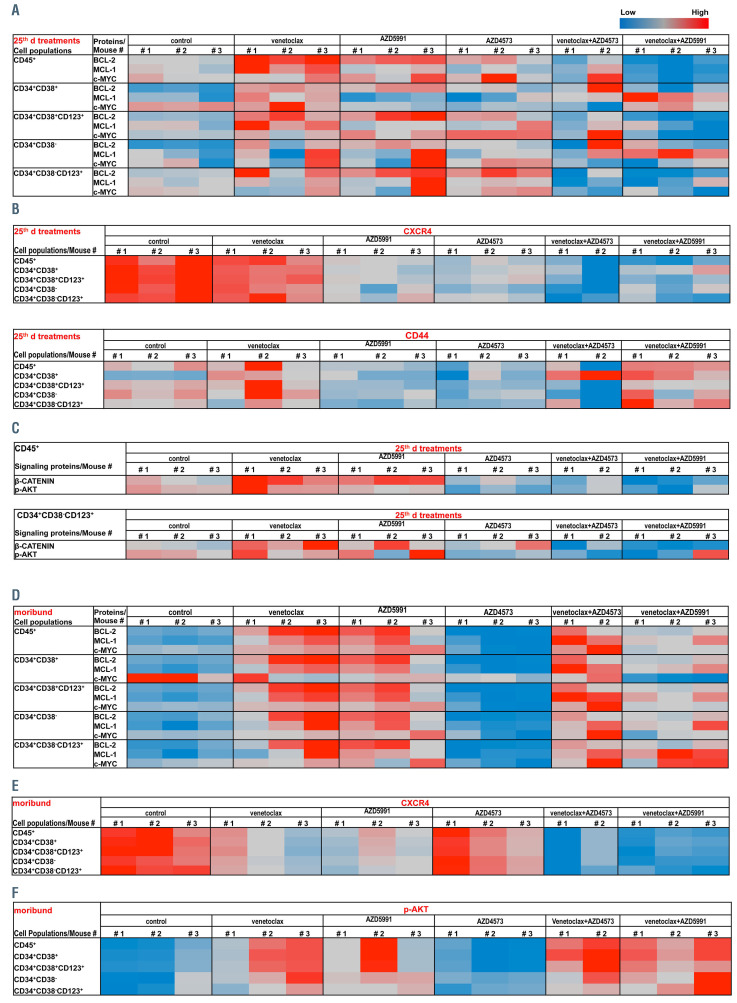
Figure 7.
Protein levels in various leukemia cell populations in mouse bone marrow as determined by CyTOF. Bone marrow (BM) cells were collected from the mice on day (d) 25 of treatment (A to C) or from moribund mice (D to F) from each treatment group (n=2 or 3 mice/group). (A and D). BCL-2, MCL-1, and c-MYC levels in various leukemia cell populations in each treatment group. (B and E) Cell surface expression levels of CXCR4 and CD44 (B) or CXCR4 (E) in various cell populations in each treatment group. (C) β-CATENIN and p-AKT levels in CD45+ and CD34+CD38-CD123+ cells. (F) p-AKT levels in various cell populations. The protein levels of individual samples are presented as heat maps. After stained with antibodies against cell surface markers, all BM samples collected at d 25 treatment were barcoded, pooled into the same tube, stained, and run concomitantly and all BM samples collected from moribund mice were barcoded, pooled into the same tube, stained, and run concomitantly.

