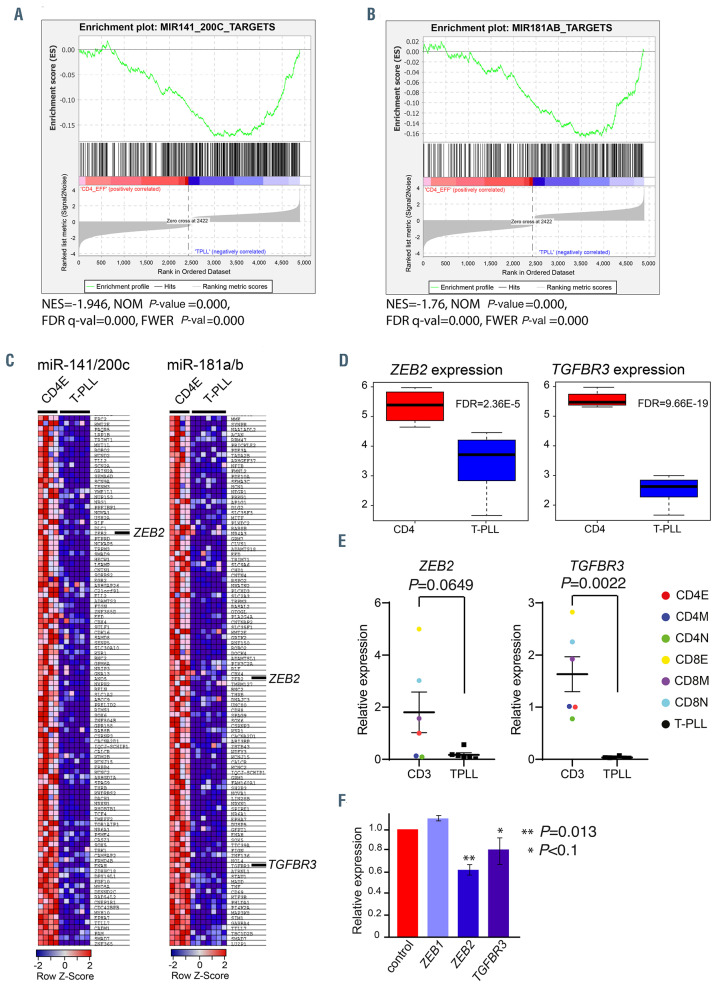
Figure 3.
MicroRNA target analysis. (A and B) Gene set enrichment analysis (GSEA) of miR-200c/141 (A) and miR-181a/b (B) predicted targets (www.targetscan.org). In red are shown upregulated genes and in blue downregulated genes. The enrichment is indicated by the green line. NES is the normalized enrichment score. The significance is given by the normalized (NOM) P-value, false discovery rate (FDR) q-val and family-wise error rate (FWER) P-val. (C) Significantly downregulated target genes for the indicated microRNA (miRNA) are shown. (D) Box plots showing the expression of ZEB2 and TGFbR3 in T-cell-prolymphocytic leukemia (T-PLL) compared to effector CD4 T cells. The statistical significance is indicated by the FDR value. (E) Average expression of ZEB2 and TGFbR3 relative to GAPDH and CD4 effector cells is shown. Samples were measured in triplicate. Statistical significance was determined with a Mann-Whitney-U test. E: effector subset; M: memory subset; N: naïve subset. (F) Expression of miR-200c/141 targets in Jurkat cells that are transduced with retroviruses expressing miR-200c/141, relative to the expression in Jurkat cells transduced with empty vector (EV)-control virus (red). Statistical significance was determined with a Student’s t-test.

