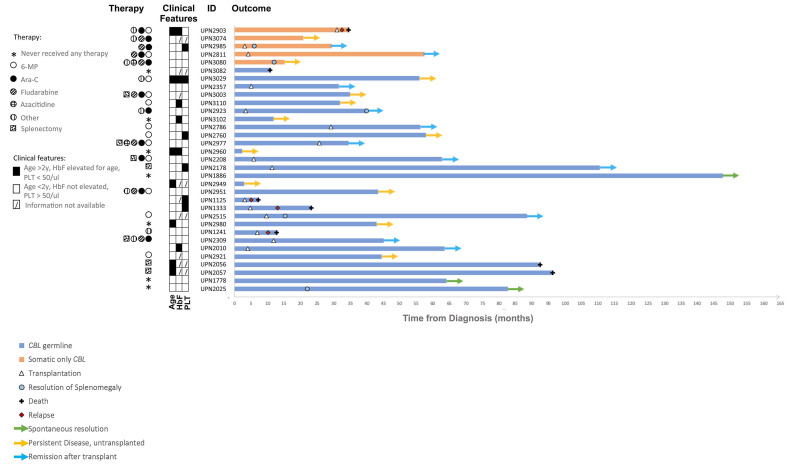
Figure 3.
Swimmer plot showing the clinical course of each patient over time. Each bar represents one patient color-coded based on the presence of germline CBL (blue) or somatic-only CBL (orange). Dates of hematopoietic stem cell transplantation (HSCT), relapse, death or resolution of splenomegaly are depicted by symbols. The current ongoing status of the patient is depicted as a color-coded arrow. Therapeutic agents received by the patient (before HSCT if applicable) are shown on the left side with pattern-coded dots. Clinical features (age, hemoglobin F levels and platelet counts at diagnosis are depicted as filled (if true) or empty (if false) boxes. Dashed boxes are used if data were not available. Information on treatment was missing for patients UPN1125, UPN2949 and UPN 2357; patient UPN2949 was lost to follow-up. HbF: hemoglobin F; PLT: platelet count.

