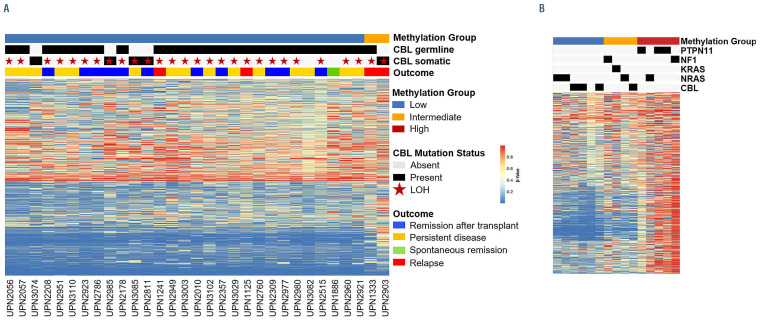
Figure 4.
DNA methylation profiles of patients with CBL-mutated juvenile myelomonocytic leukemia. (A) CBL mutant samples profiled by MethylSeq classified according to the international juvenile myelomonocytic leukemia (JMML) consensus signature. (B) DNA methylation groups low, intermediate, and high were defined using an international cohort of JMML samples described by Schönung et al.12 Each CBL mutant sample was classified into one of the three methylation groups based on minimum distance to the nearest centroid. Heatmaps (A and B) show the b values of 1,386 CpG loci used for methylation classification. LOH: Loss of heterozygosity. Two patients in the low methylation group are not depicted in (A) because their methylation data were generated with an Illumina 450k array.

