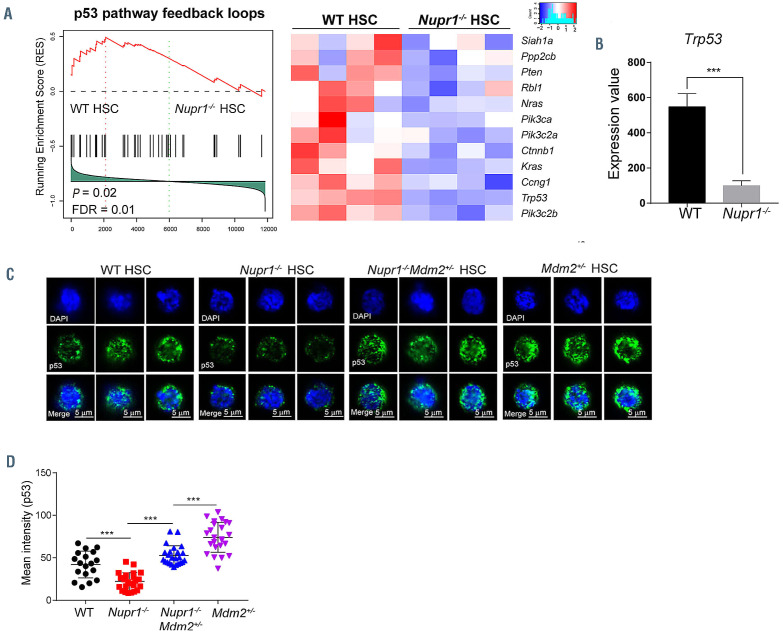
Figure 5.
Loss of Nupr1 confers repopulating advantage on hematopoietic stem cells by regulating p53 check-point signaling. (A) Gene set enrichment analysis (GSEA) of p53 pathway feedback loops in wildtype (WT) hematopoietic stem cells (HSC) and Nupr1-/- HSC. One thousand HSC from the bone marrow of WT and Nupr1-/- mice were sorted as individual samples for RNA-sequencing. DESeq2 normalized values of the expression data were used for GSEA. Expression of the leading-edge gene subsets is shown. p53 pathway feedback loops that are downregulated in Nupr1-/- HSC (>1.2-fold difference in expression; adjusted P value <0.05). WT HSC, n=4 cell sample replicates (one per column); Nupr1-/- HSC, n=4 cell sample replicates (one per column). FDR: false discovery rate. (B) Expression level of p53 in WT HSC and Nupr1-/- HSC determined by RNA-sequencing. The Y-axis indicates the expression value (DESeq2 normalized values of the expression data. Data were analyzed using an unpaired Student t-test (two-tailed) and are represented as mean ± standard deviation (SD) (n=4 mice for each group). ***P<0.001. (C) Immunofluorescence measurement of p53 proteins in single HSC from WT, Nupr1-/-, Mdm2+/-Nupr1-/- and Mdm2+/- mice. Images of three representative single cells from each group are shown. (D) Mean intensity of p53 fluorescence in WT, Nupr1-/-, Mdm2+/-Nupr1-/- and Mdm2+/- HSC. Each dot represents a single cell. Data were analyzed by one-way analysis of variance and are represented as mean ± SD. WT, n=18; Nupr1-/-, Mdm2+/-Nupr1-/-, Mdm2+/-: n=25. ***P<0.001.

