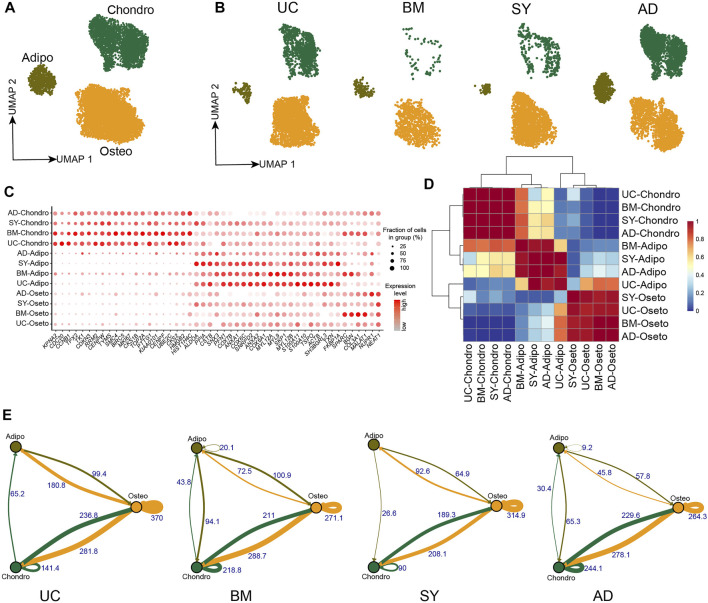
FIGURE 1.
MSC subpopulations in 4 different tissues. (A). UMAP projection of MSCs in 4 different tissues, colored by MSC subpopulations. (B). UMAP projection of MSCs from each tissue, namely UC-MSCs, BM-MSCs, SY-MSCs, and AD-MSCs. (C). Dot plot of the expression of subpopulation-specific genes in the MSC subpopulations. (D). Heatmap of AUROC scores between MSC subpopulations pairs, in which AUROC scores represent similarities between subpopulations. (E). Weighted ligand-receptor interactions between MSC subpopulations pairs in each tissue based on STRING database. The edge thickness and corresponding numbers indicate the sum of weighted paths between subpopulations.

