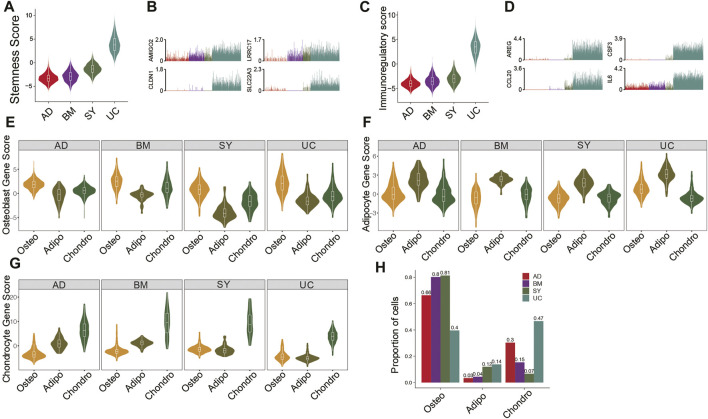
FIGURE 2.
Features and lineage-specific differentiation potentials of MSC subpopulations. (A). Violin plot of stemness scores of MSCs in 4 different tissues. (B). Bar plot of the expression level of AMIGO2, CLDN1, LRRC17, and SLC22A3 in each cell. (C). Violin plot of immunoregulatory scores of MSCs in 4 different tissues. (D). Bar plot of the expression level of AREG, CSF3, CCL20, and IL6 in each cell. (E–G). Violin plot of osteocyte score. (E), adipocyte score. (F), and chondrocyte score. (G) of MSCs in MSC subpopulations. (H). Fractions of MSC subpopulations in MSCs for each tissue.

