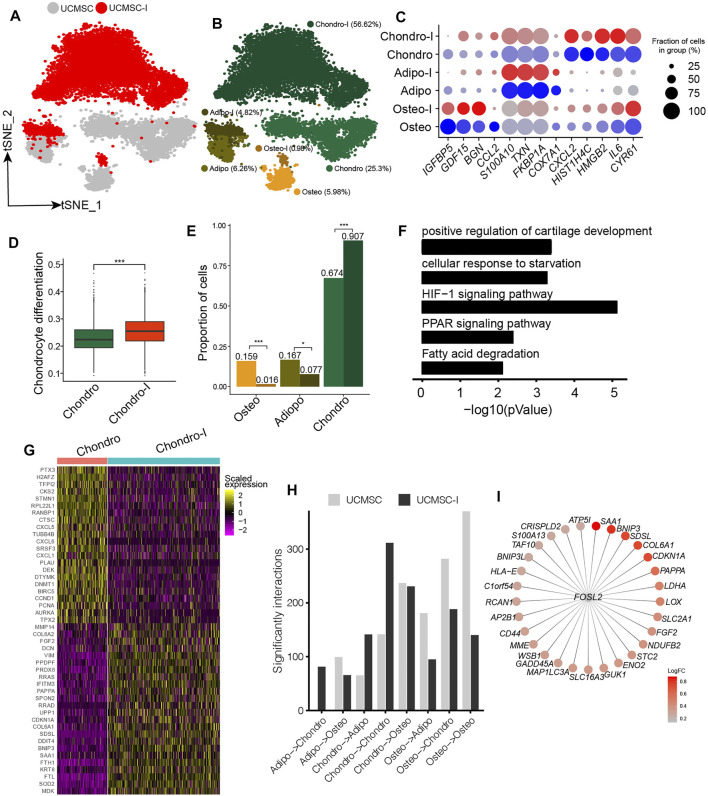
FIGURE 3.
Response heterogeneity and dynamics of MSCs to chondrogenesis induction and its underlying mechanisms. (A). t-SNE projection of MSCs pre-and post- chondrogenesis induction, colored by non-induced UC-MSC (UC-MSCs) and chondrogenic-induced MSCs (UCMSC-I). (B). t-SNE projection of MSCs pre-and post- chondrogenesis induction, colored by the six MSC subpopulations, namely chondro, osteo, adipo, chondro-I, osteo-I, and adipo-I. (C). Dot plot of the expression level of lineage-specific genes in MSC subpopulations pre-and post-chondrogenesis induction. (D). Boxplot of chondrocyte differentiation scores of pre-induced chondro (Chondro) and chondrogenic-induced chondro (Chondro-I). Wilcoxon Rank Sum test, ***p < 0.001. (E). Fractions of MSC subpopulation in MSCs and chondrogenic-induced MSCs. Fisher’s exact test, *p value <0.01, ***p value <0.001. (F). The significantly enriched GO terms in chondro-I specific genes compared to non-induced chondro. (G). Heatmap of the most significantly differentially expressed genes between pro-and post-induced chondro. (H). Bar plot of significant interactions between MSC subpopulations pairs in UC-MSCs and UCMSC-I. (I). Bubble plot of FOSL2 and its target genes, with each target gene colored by log fold change between post-induced chondro and pre-induced chondro.

