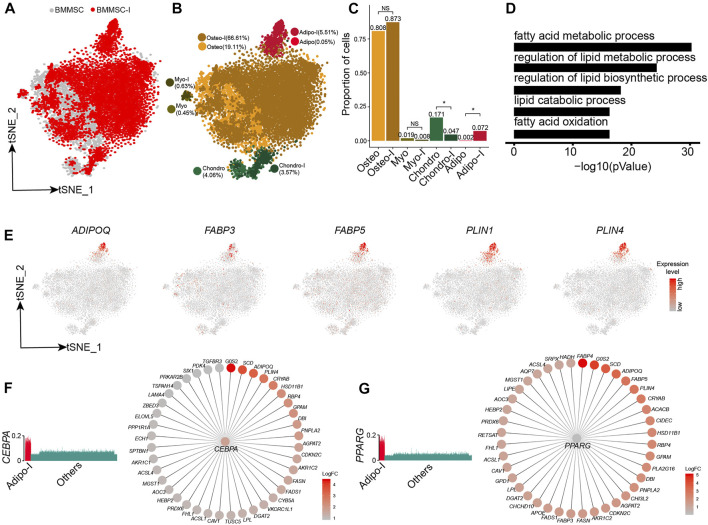
FIGURE 5.
Response heterogeneity and dynamics of MSCs to adipogenesis induction and its underlying mechanisms. (A). t-SNE projection of MSCs pre-and post-adipogenesis induction, colored by non-induced BM-MSC (BM-MSCs) and adipogenic-induced MSCs (BMMSC-I). (B). t-SNE projection of MSCs pre-and post-adipogenesis induction, colored by MSC subpopulations, namely chondro, osteo, adipo, myo, chondro-I, osteo-I, adipo-I, and myo-I. (C). Fractions of MSC subpopulation in BM-MSCs and adipogenesis-induced MSCs. Fisher’s exact test, * p-value < 0.05. (D). Significantly enriched GO terms in adipo-specific genes. (E). Expression of adipogenic lineage-specific genes on t-SNE projection of MSCs. (F). Expression of CEBPA in single cells (left panel), CEBPA and its target genes, with each target gene colored by log fold change between adipogenesis-induced adipo and pre-induced adipo (right panel). (G). Expression of PPARG in single cells (left panel), PPARG and its target genes, with each target gene colored by log fold change between adipogenesis-induced adipo and pre-induced adipo (right panel).

