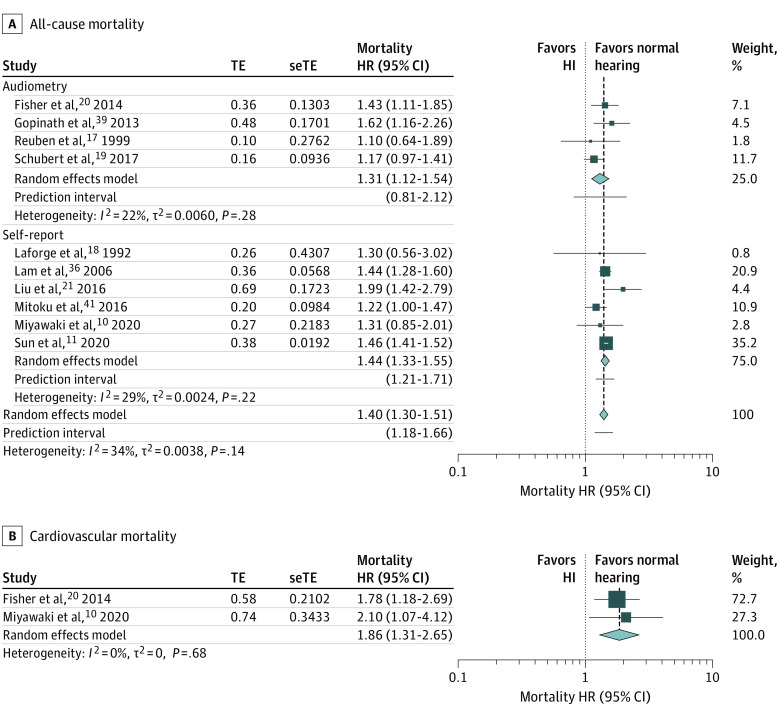
Figure 3. Forest Plots Showing the Longitudinal Association Between Dual Sensory Loss and (A) All-Cause Mortality, Stratified by the Method of Hearing and Vision Assessment, and (B) Cardiovascular Mortality.
Diamonds are the estimated pooled hazard ratio (HR) for each random-effects meta-analysis; box sizes reflect the relative weight apportioned to studies in the meta-analysis. HI indicates hearing impairment; seTE, standard error treatment effect; TE, treatment effect.

