
Extended Data Fig. 2. Cell cluster proportions vary across tissue types.
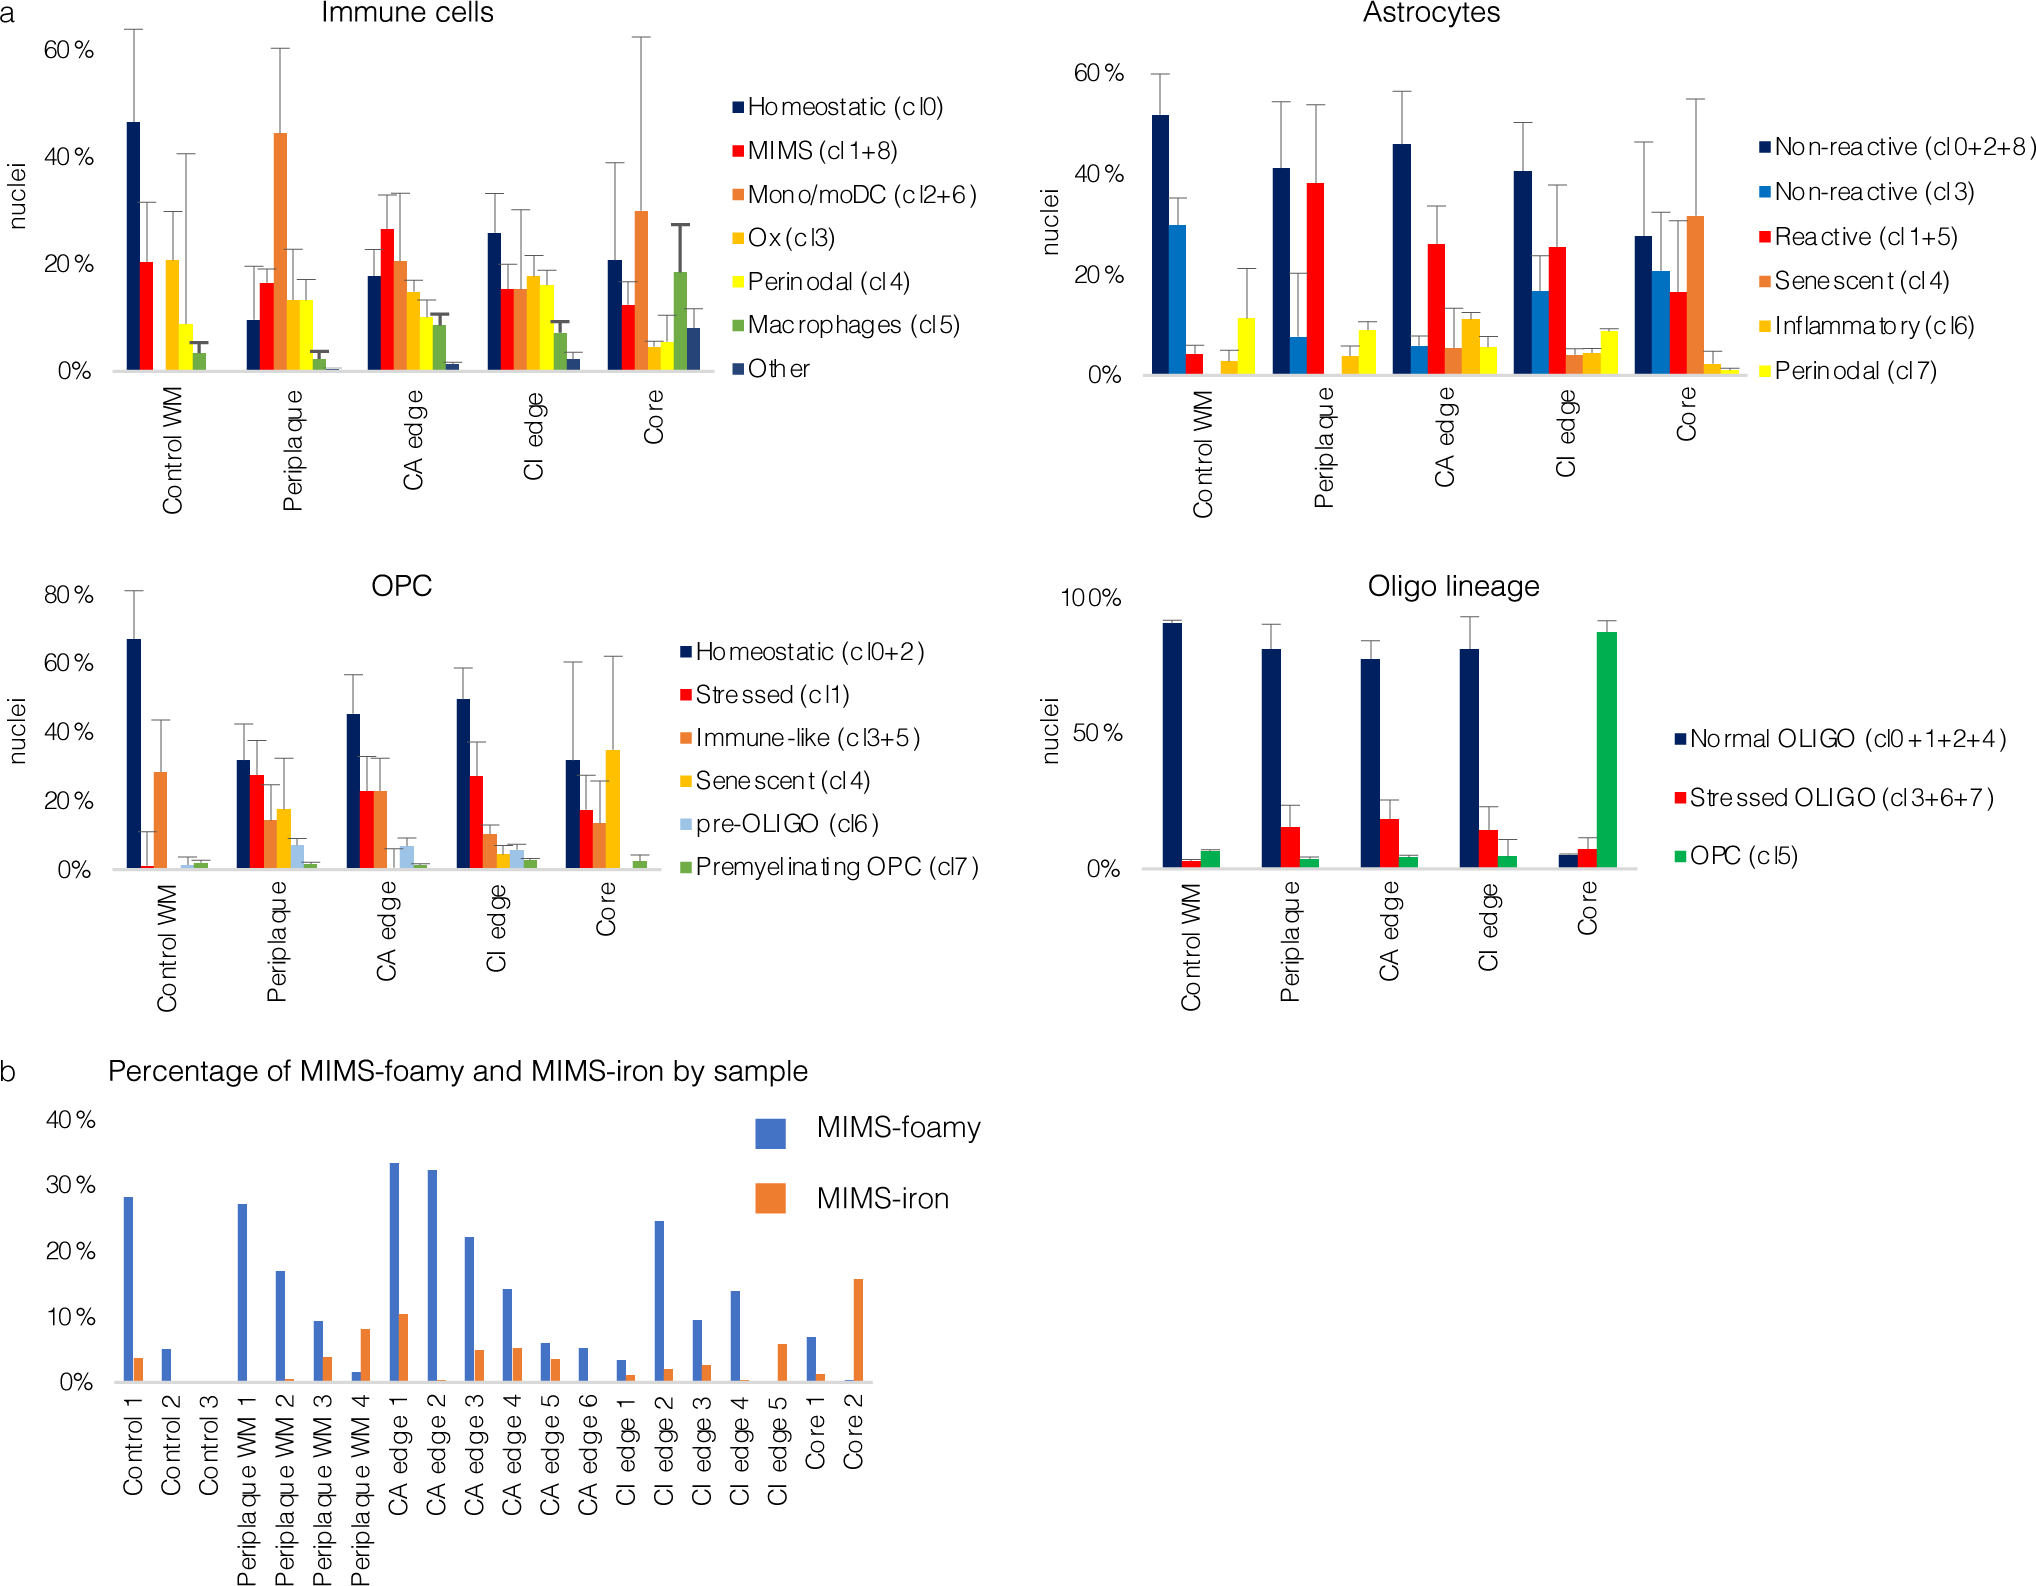
(a) Bar graphs showing the distribution of nuclei percentages by cell type (mean, standard error). See Fig. 2 for corresponding UMAP plots and distribution of nuclei count per sample.
(b) Bar graph showing the percentage of MIMS-foamy and MIMS-iron nuclei for each sample and location.
WM=white matter; CA=chronic active; CI=chronic inactive; UMAP=uniform manifold approximation and projection; MIMS=microglia inflamed in multiple sclerosis; OPC=oligodendrocyte progenitor cell; monoDC=monocyte/dendritic cell; Ox=oxidative stress.