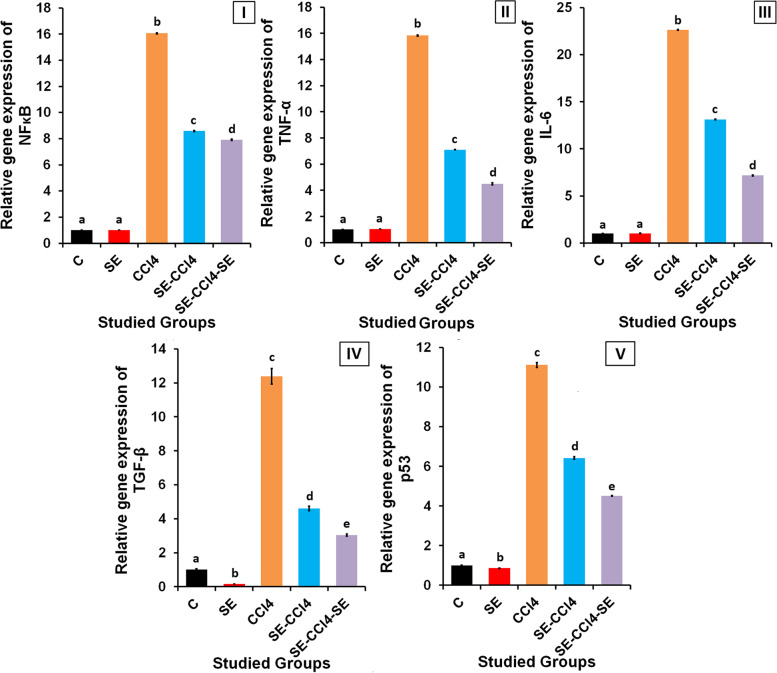
Fig. 6.
Effect of SE treatment on inflammation, fibrosis and apoptosis induced by CCl4 in liver. The relative gene expression of; (I) NF-KB, (II) TNF-α, (III) IL-6, (IV) TGF-β, (V) p53. C group: oral administration with water; CCl4 group: rats injected with CCl4. SE group: rats received SE only. SE-CCl4 group: rats received SE before and during CCl4 administration. SE-CCl4-SE group: rats received SE before, during and after CCl4 administration. The results are shown as mean ± SD (n = 8). Different letters for the same parameter are significantly different at p < 0.05

