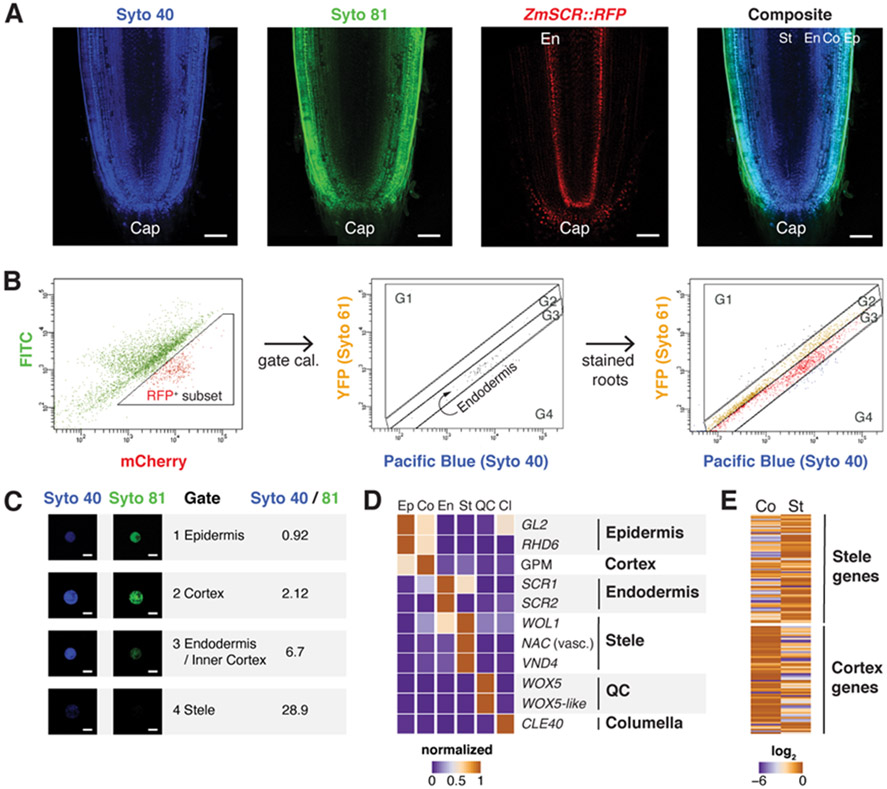
Fig. 1. Dye Penetrance Labeling (DPL) and tissue transcriptome analysis in maize.
(A) Representative images of a deeply penetrating dye (Syto 40), a superficially penetrating dye (Syto 81), the ZmSCR::tagRFPt marking endodermis, and a composite image of Syto 40 and Syto 81 staining, showing position of the endodermal (Ed) layers in dashed region. (B) Cell sorting gating strategy, showing the ZmSCR::tagRFPt population (left), backgated onto a YFP vs Pacific Blue plot with RFP positive (second from left), and (third from left) the gated boundaries for endodermal, outside of endodermis (G1,G2), and inside of endodermis (G4). (C) Validation of ratiometric cell sorting strategy by collecting sorted cells from gates and quantifying fluorescence from microscopy images. (D) Validation of sorted cell RNA-seq profiles via analysis of known markers. (E) Global validation comparing sorted cells vs. mechanically dissected stele and cortex tissues, with heat map showing expression in sorted cortex vs. stele gates, categorized by previously determined stele and cortex markers. Scale bars are 100 μm in (A) and 15 μm in (C).

