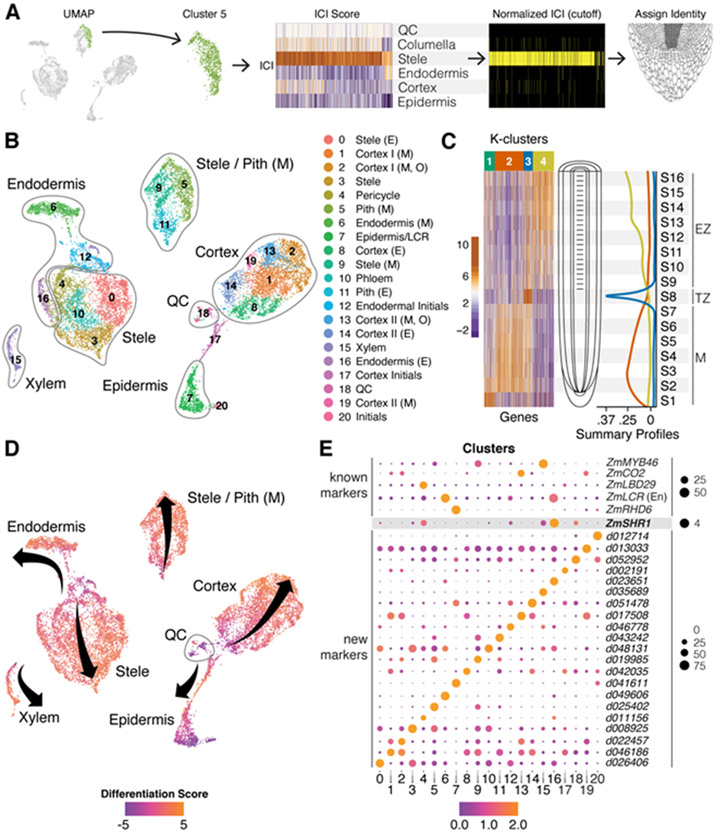
Fig. 2. Single-cell RNA-seq spatial and temporal transcriptome maps of the maize meristem.
(A) The ICI method of diagnosing cell of UMAP clusters using known markers and randomization testing (e.g., Cluster 5). (B) Cluster identities as determined by ICI and cell-type specific markers (E,early; M,mature; O,outer; Pith, pith parenchyma). (C) Heat map of highly variant genes along a longitudinal axis of the root meristem. Development patterns show transcripts/markers that peak in the early meristem (M), transition zone (TZ), and elongation zone (EZ). (D) Trajectories of developmental “pseudo-time” in each cell cluster mapped onto the same UMAP depicted in B, where a differentiation score is calculated as a log2 ratio of all EZ/M markers identified in C. Arrow origins represent cells in the meristem near the stem cells for each cell type cluster progressing to more proximal cells. (E) Select known (top) and new markers (bottom) for each cluster. Size of spot represents percent of cells in cluster expressing the marker and color represents their relative expression level in those cells.

